DataMB offers football data solutions designed to present complex statistics in an intuitive, interactive and visually compelling way. Whether you're a scout, analyst, agent, media, or fan, our tools help all actors across football fill their data needs better through custom data visualizations.
We provide a free website, a subscription-based platform, and a mobile app.
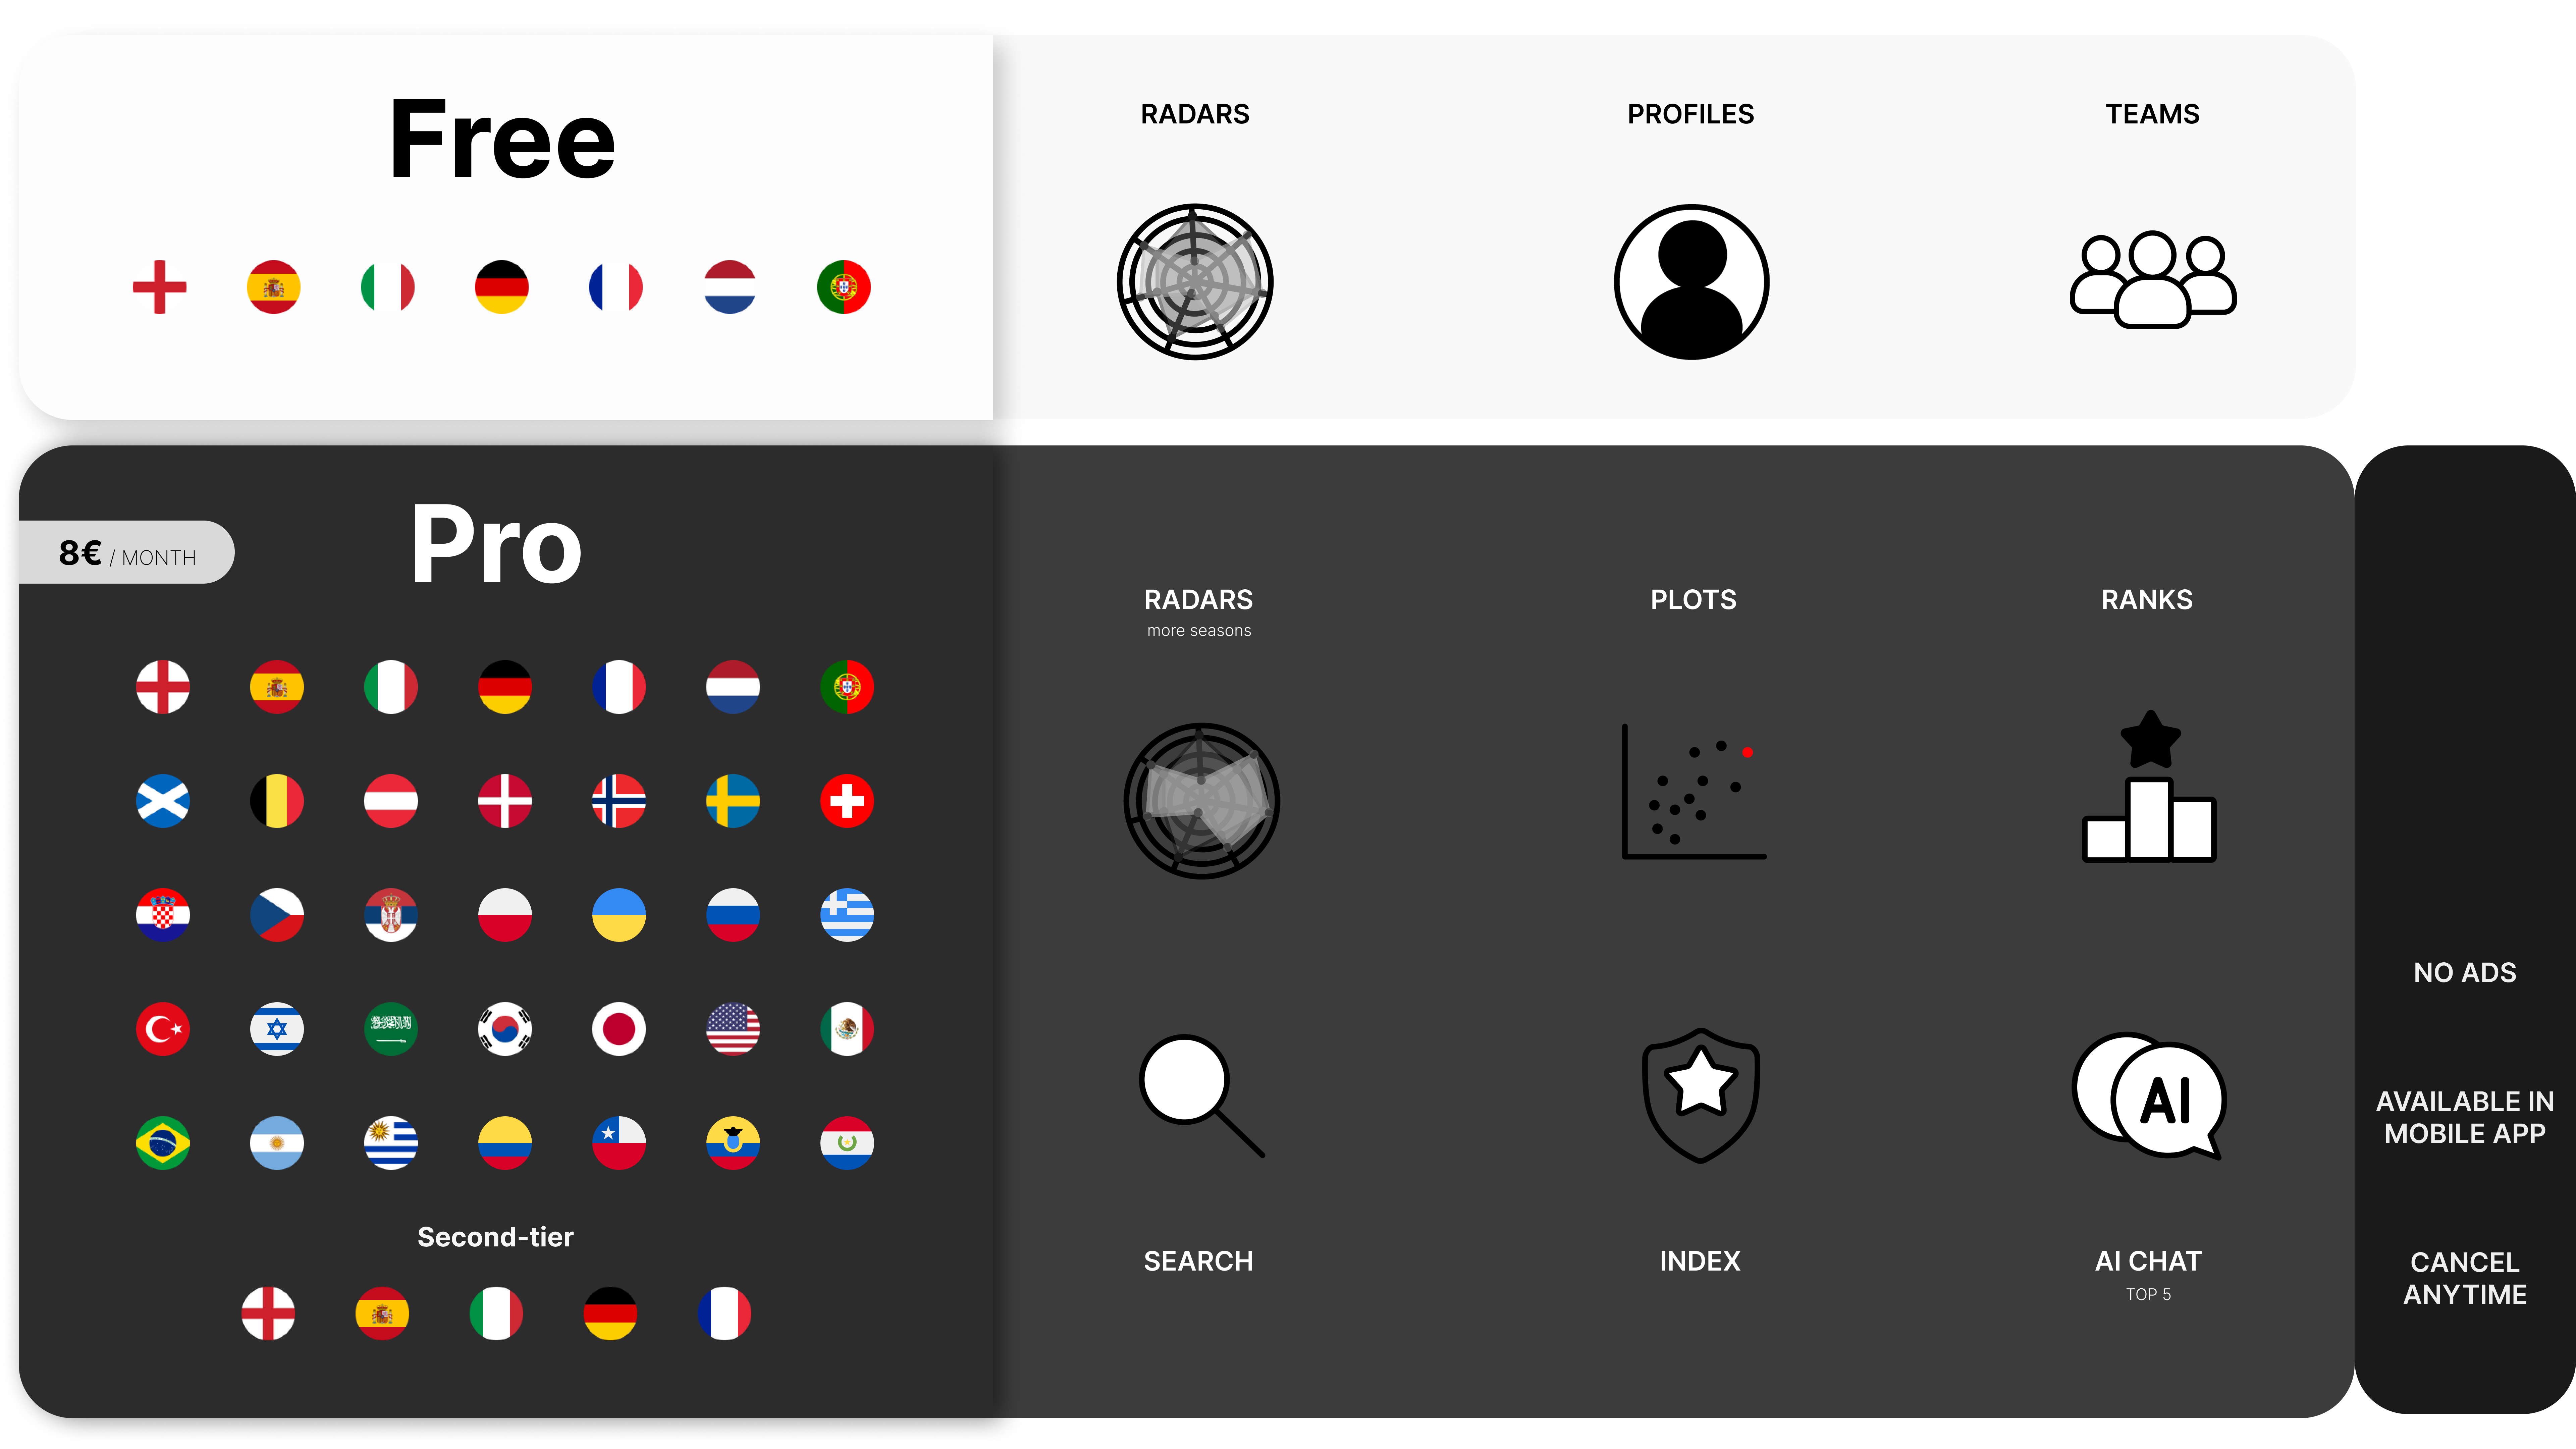
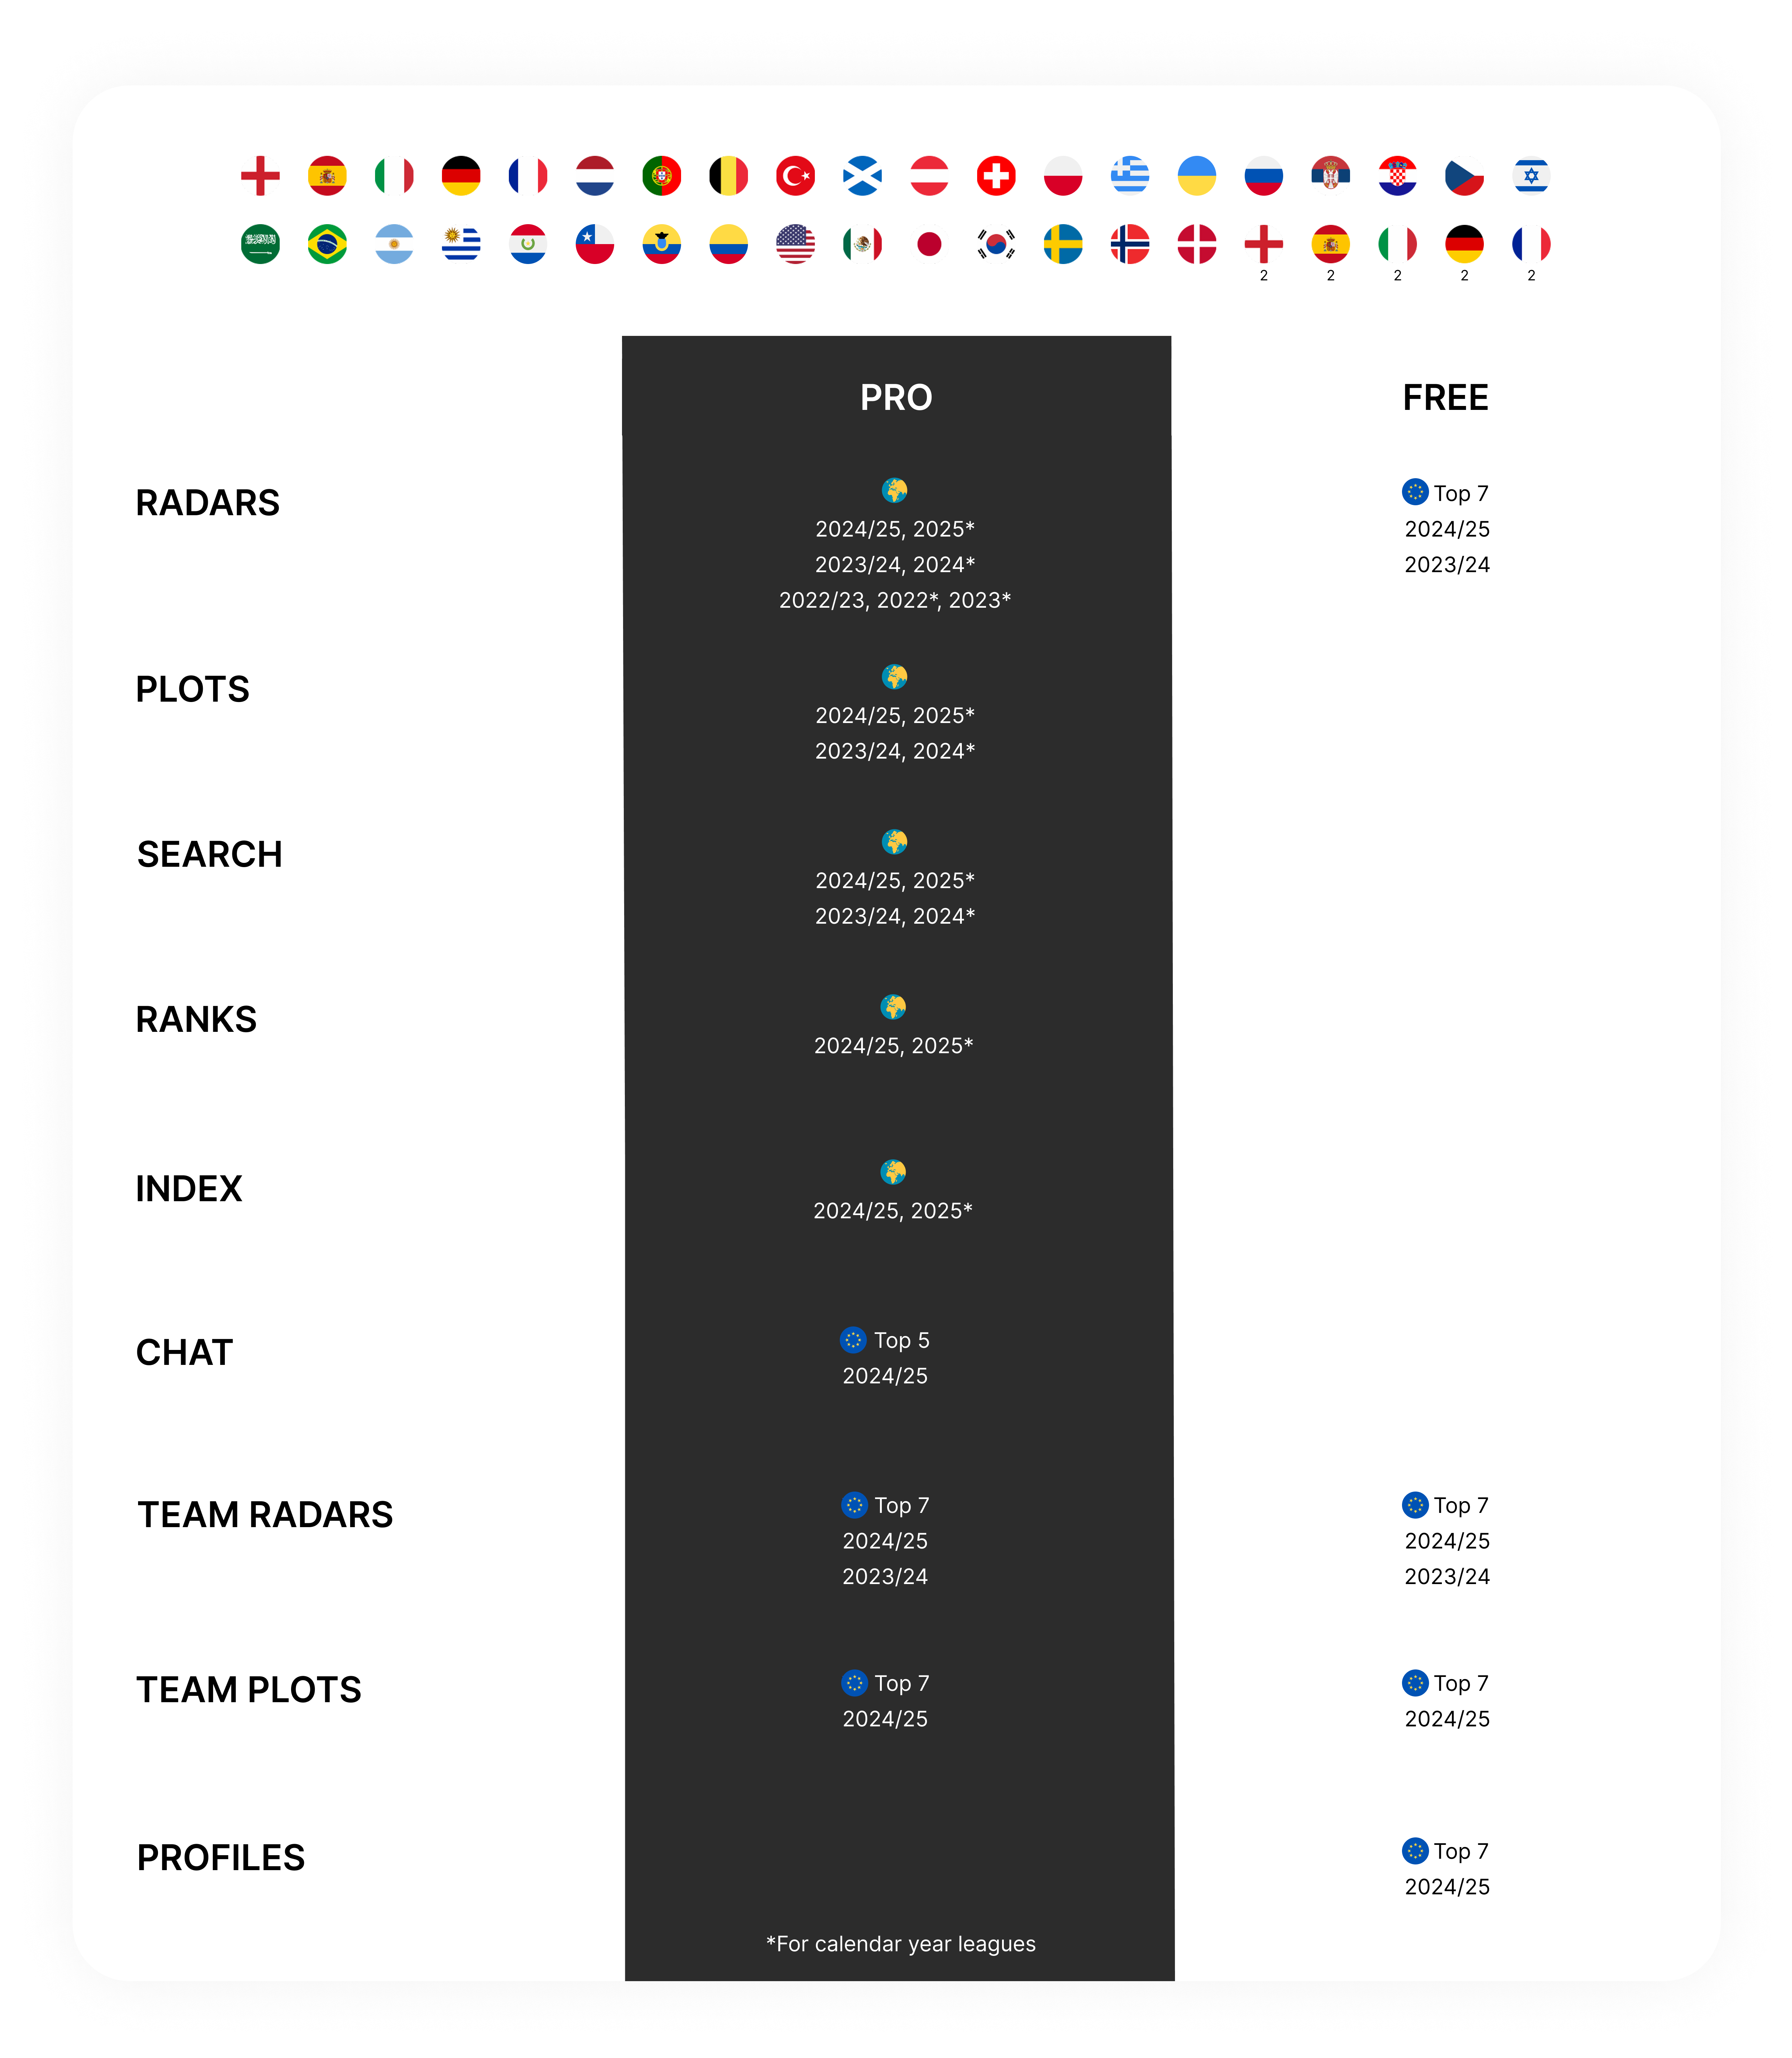
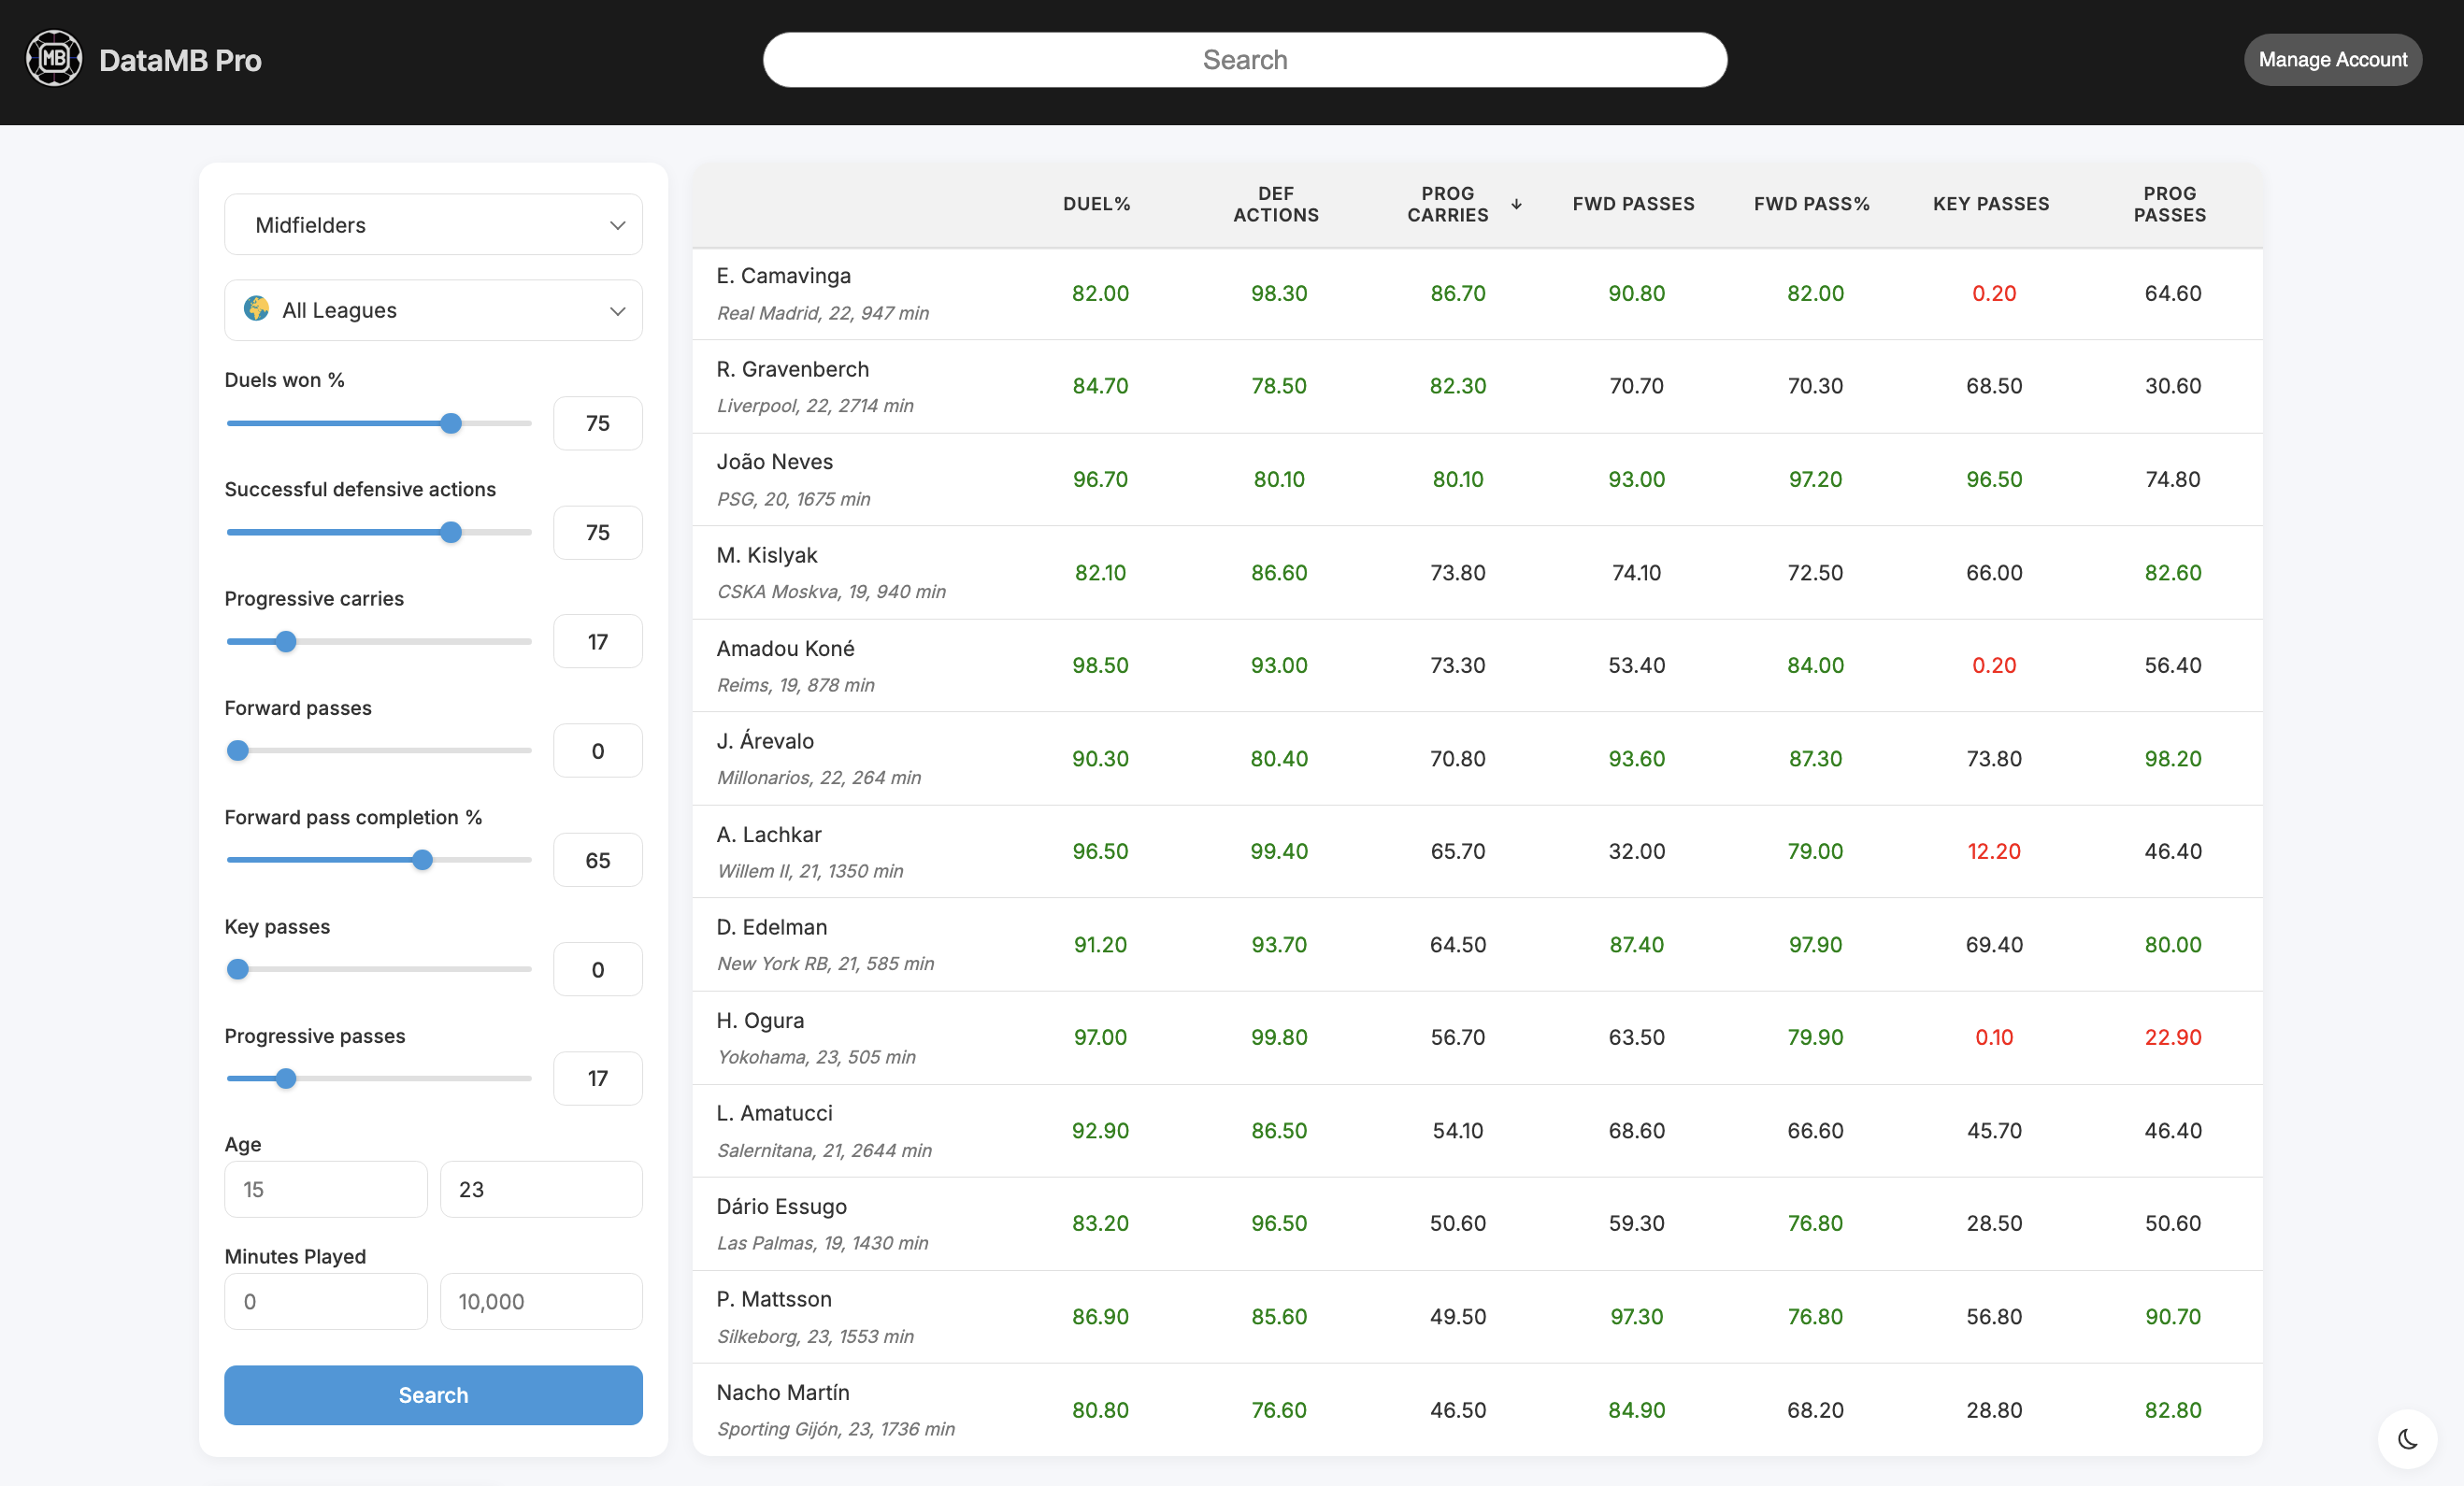
- Our comprehensive database covers 55 leagues, spanning 4 seasons, with over 120 different metrics.
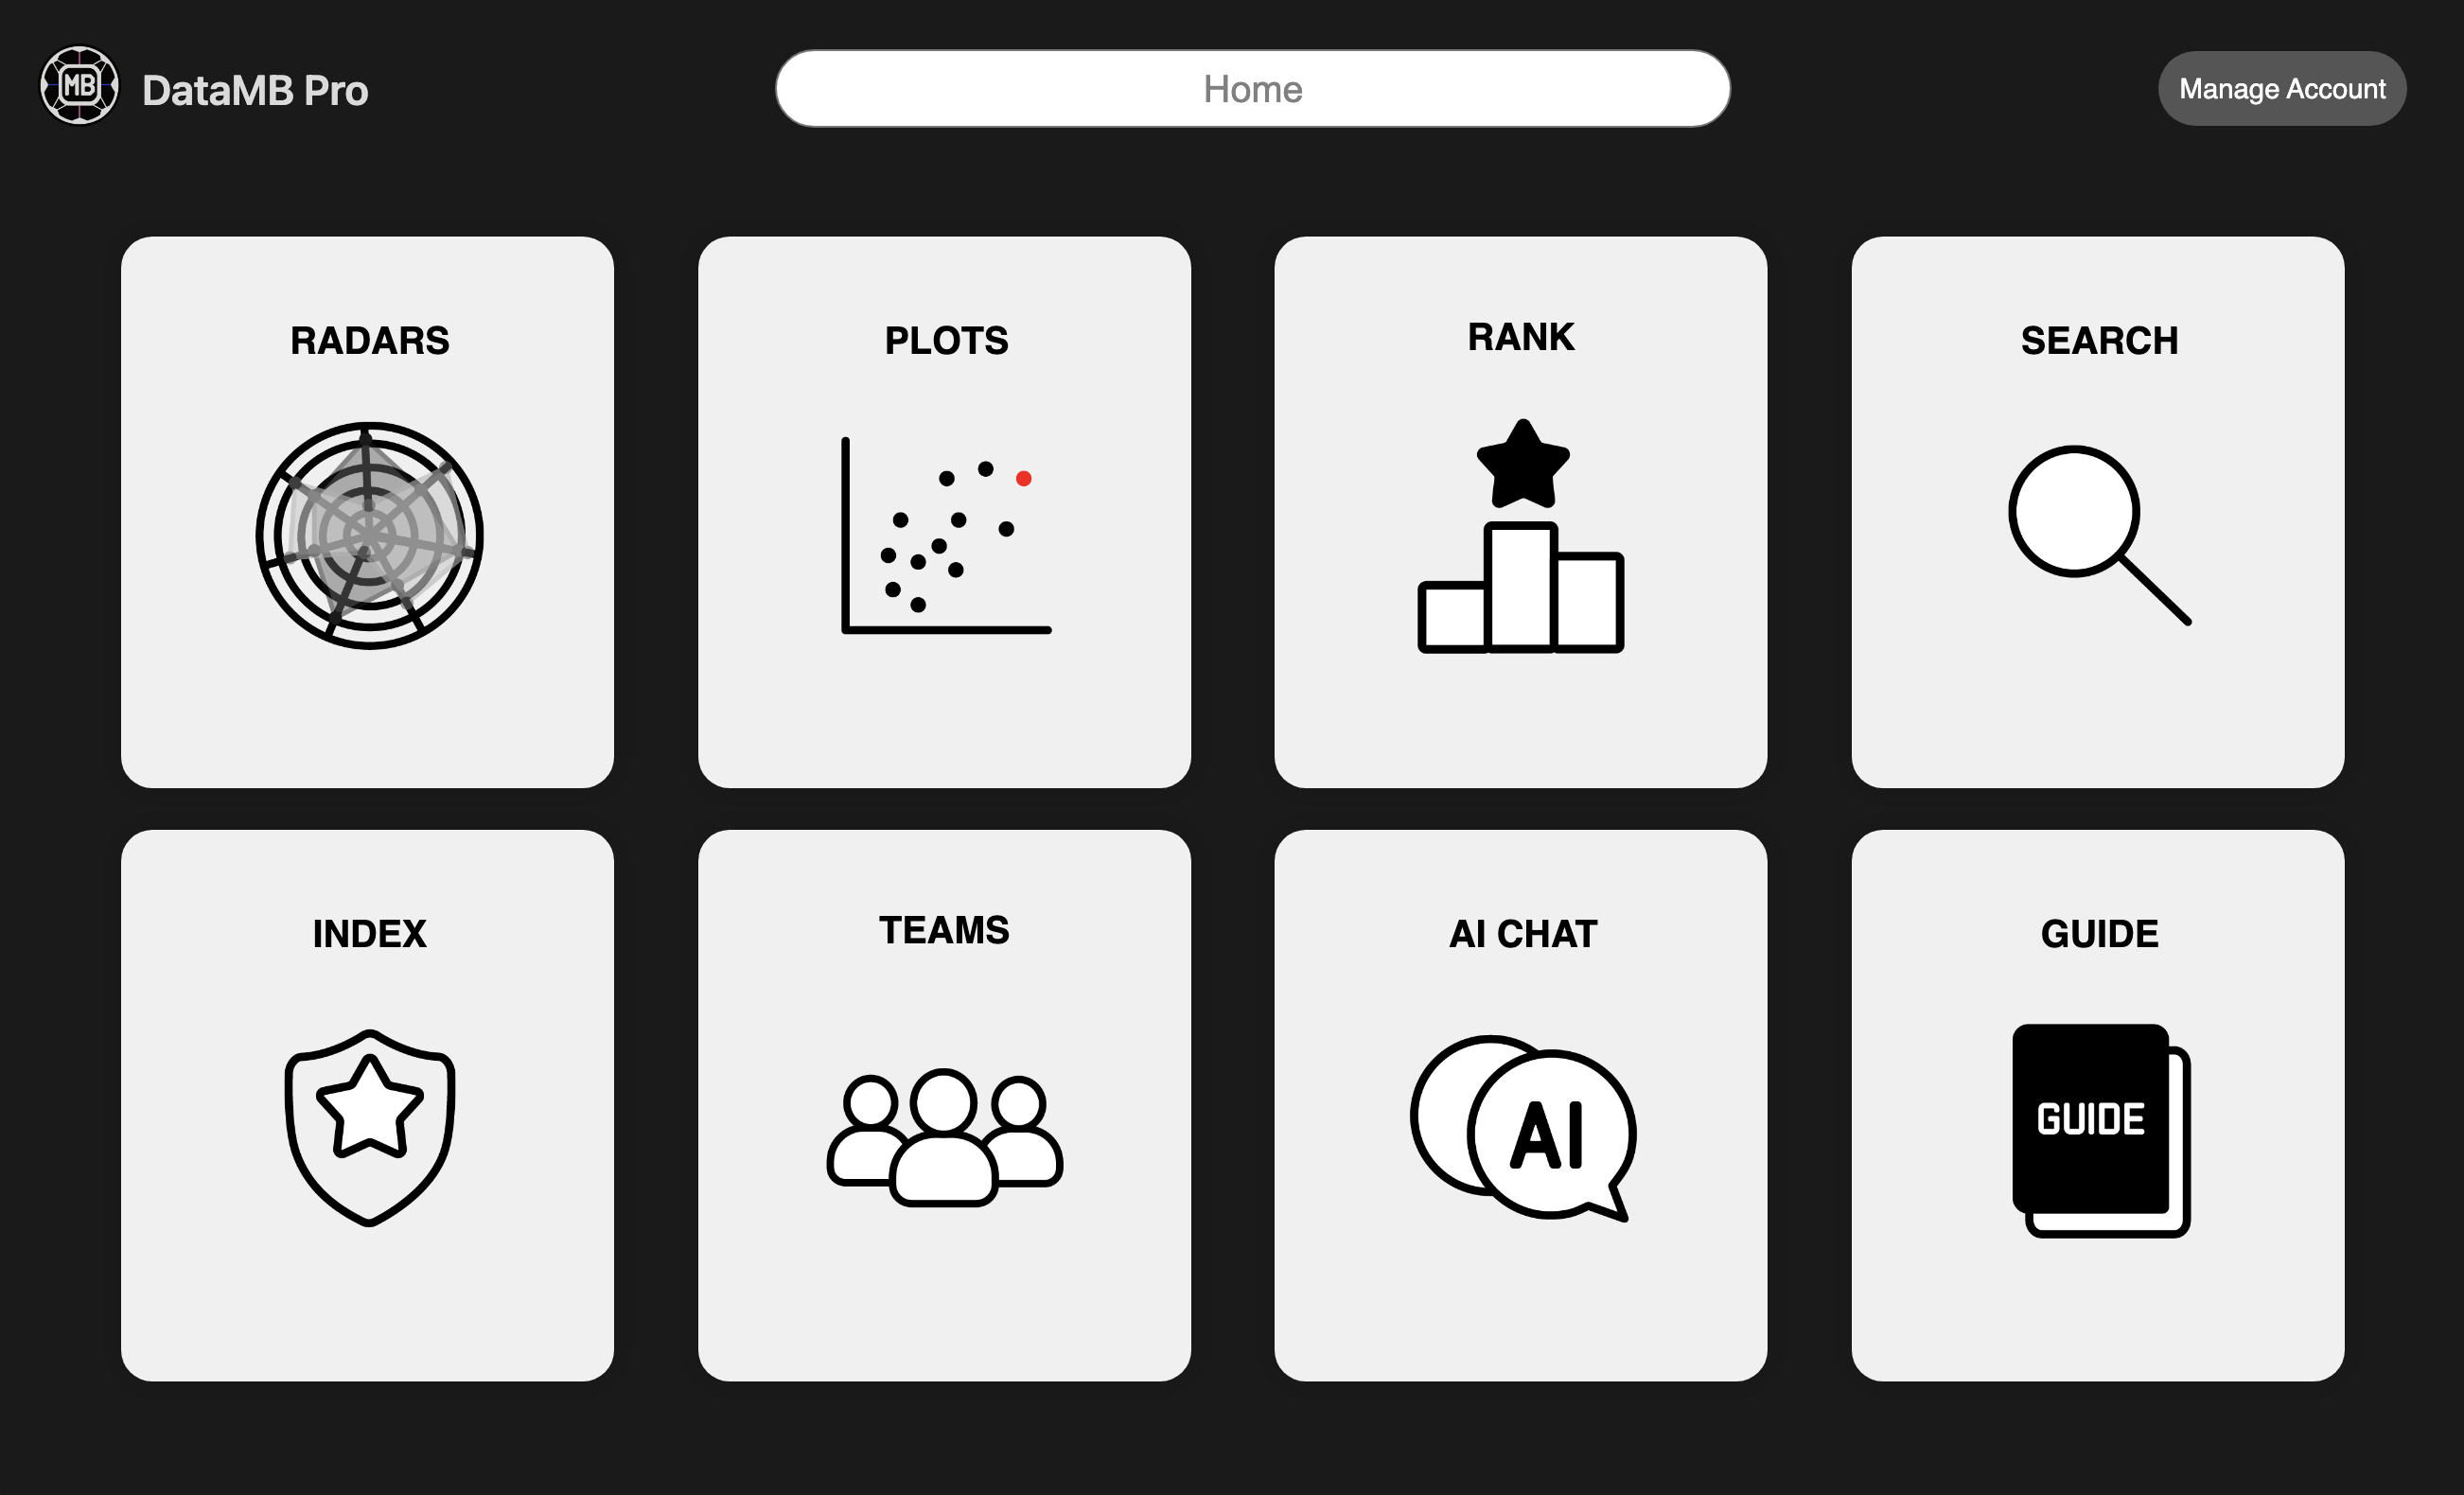
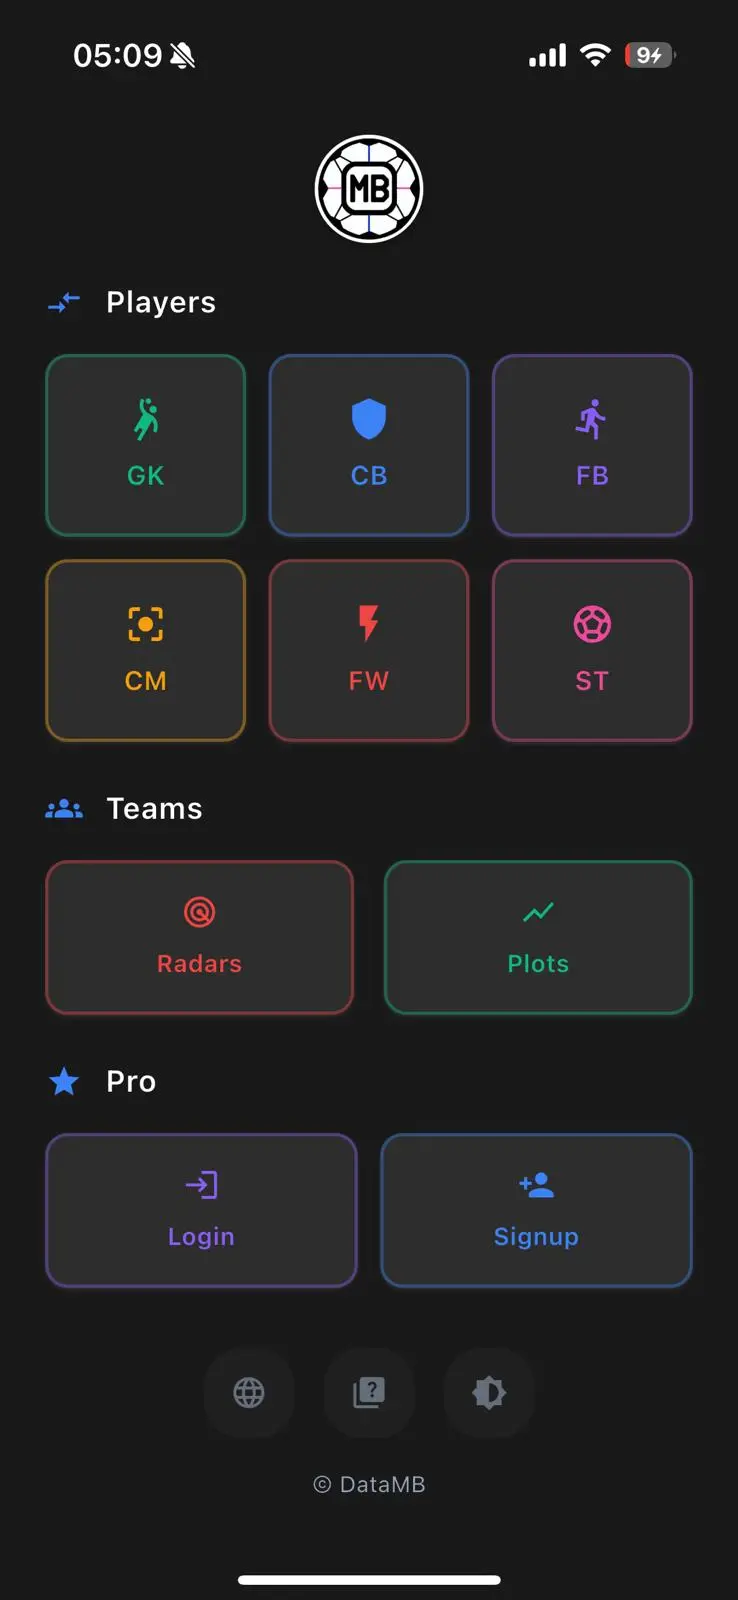
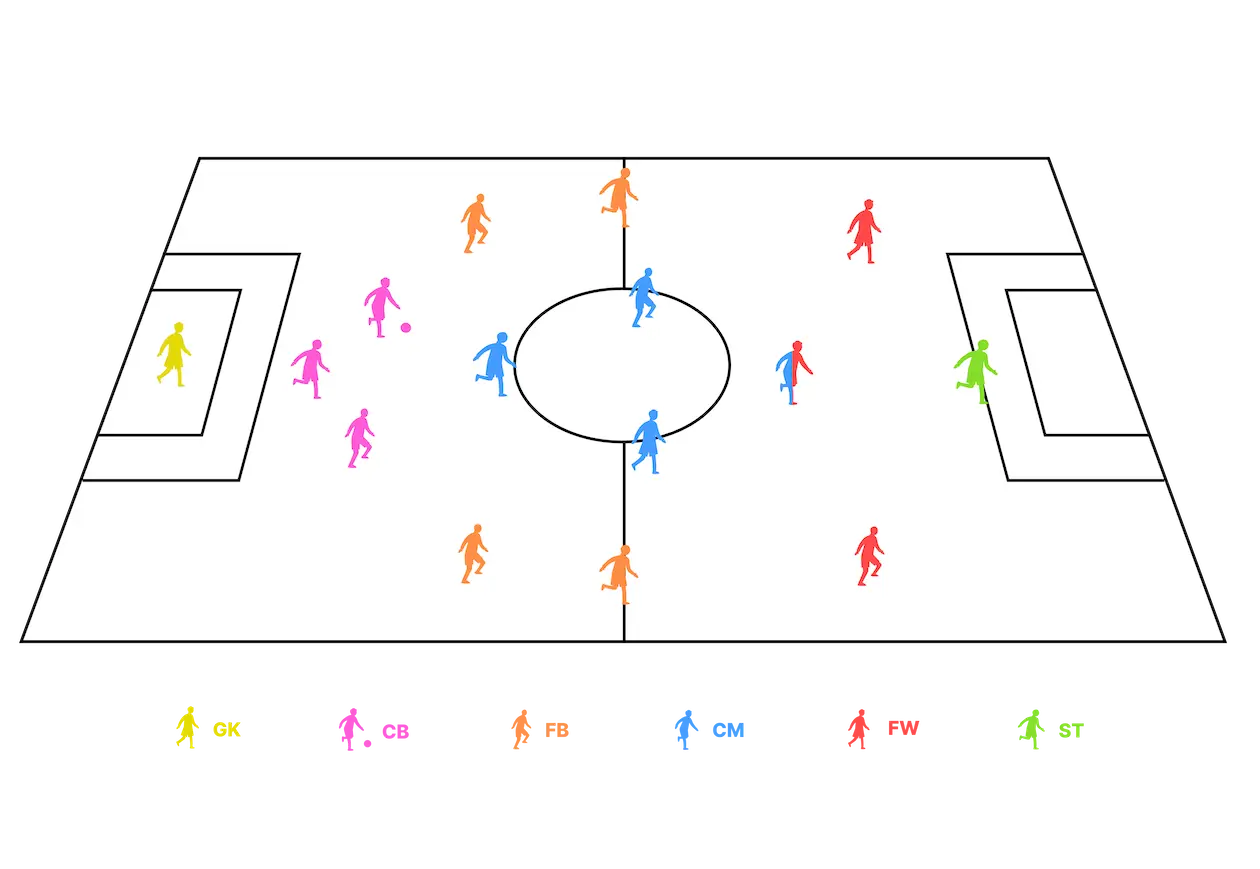
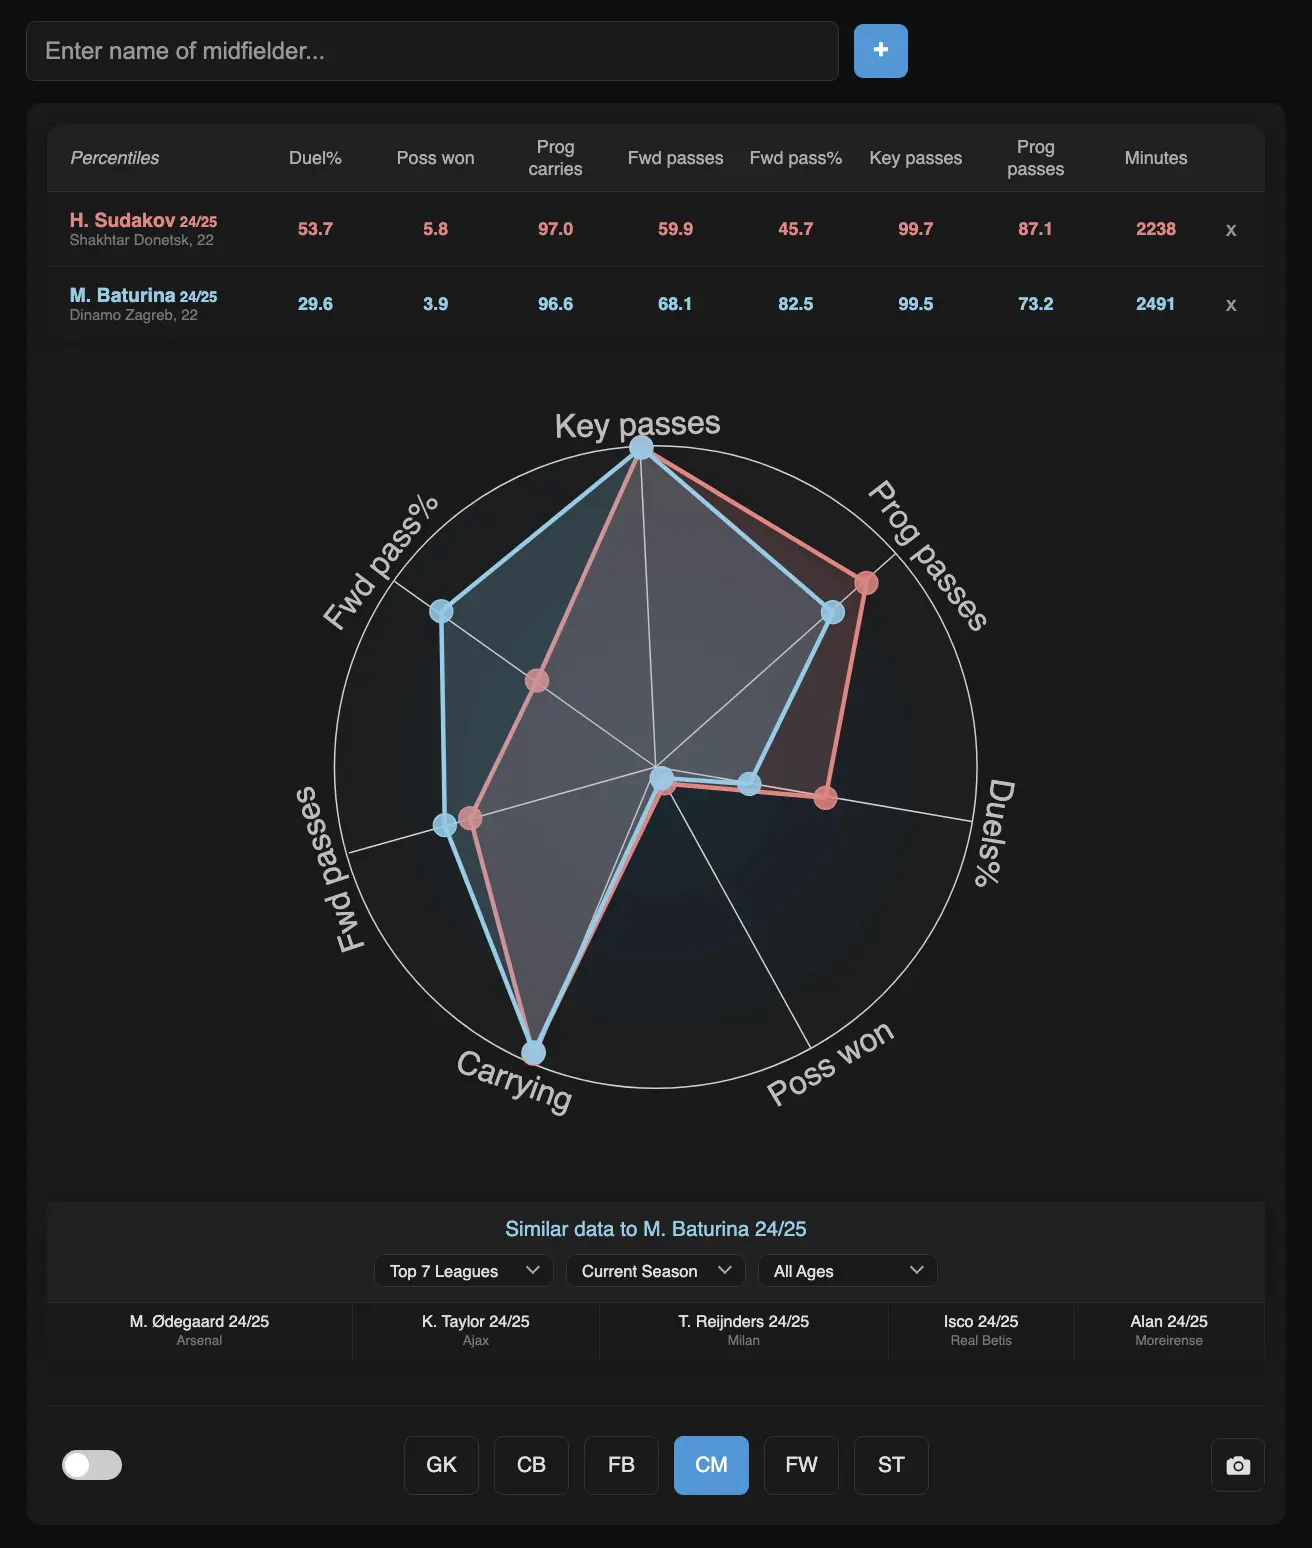
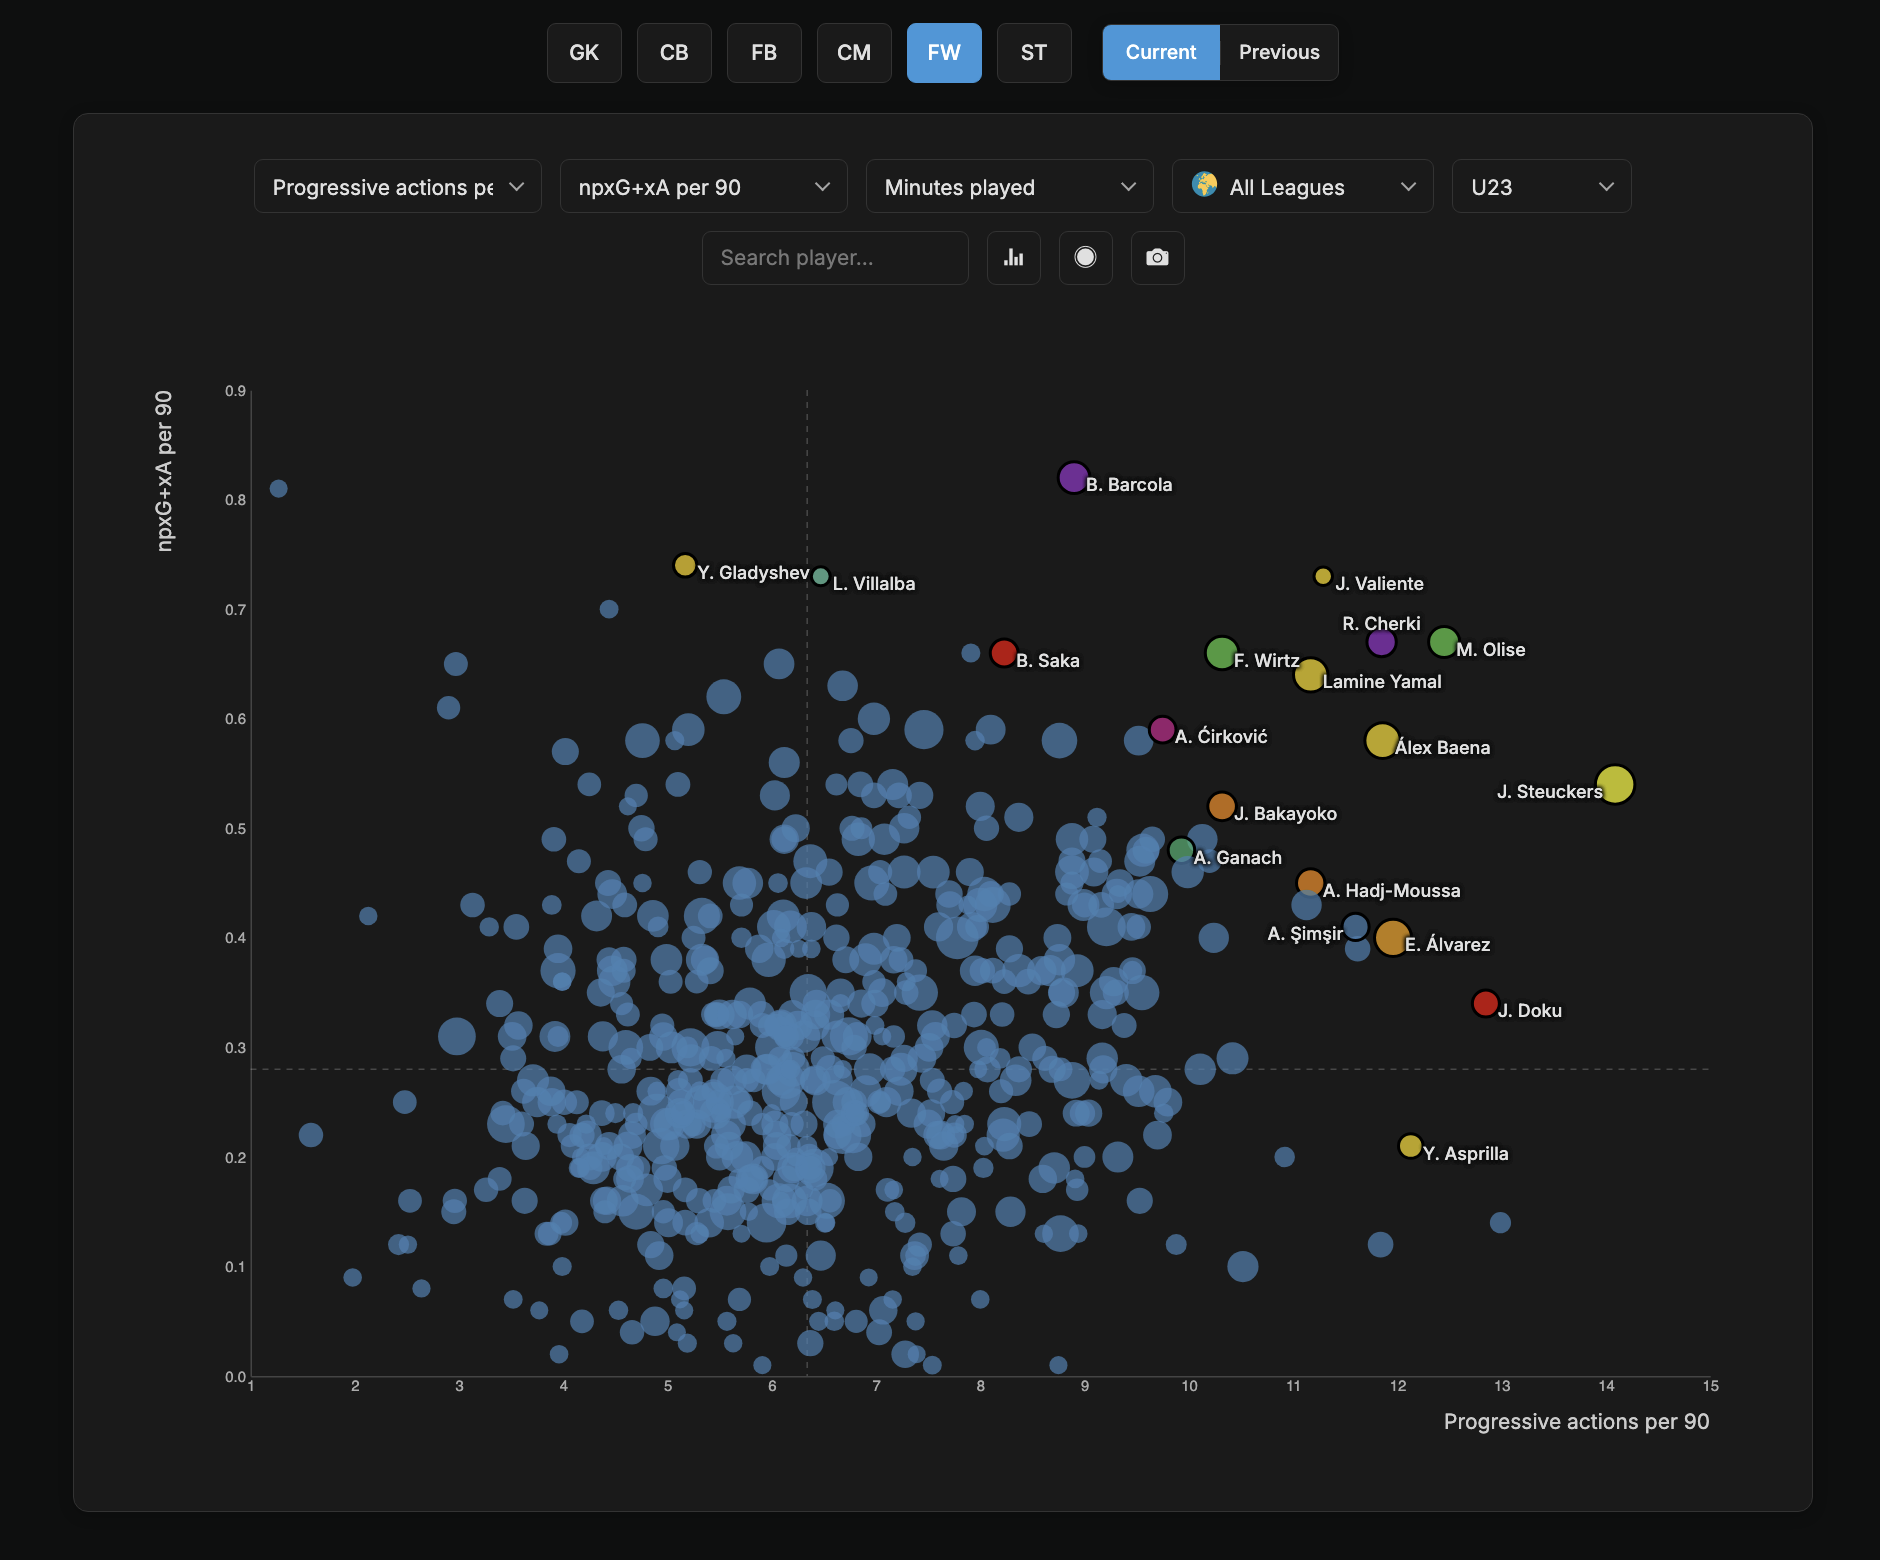
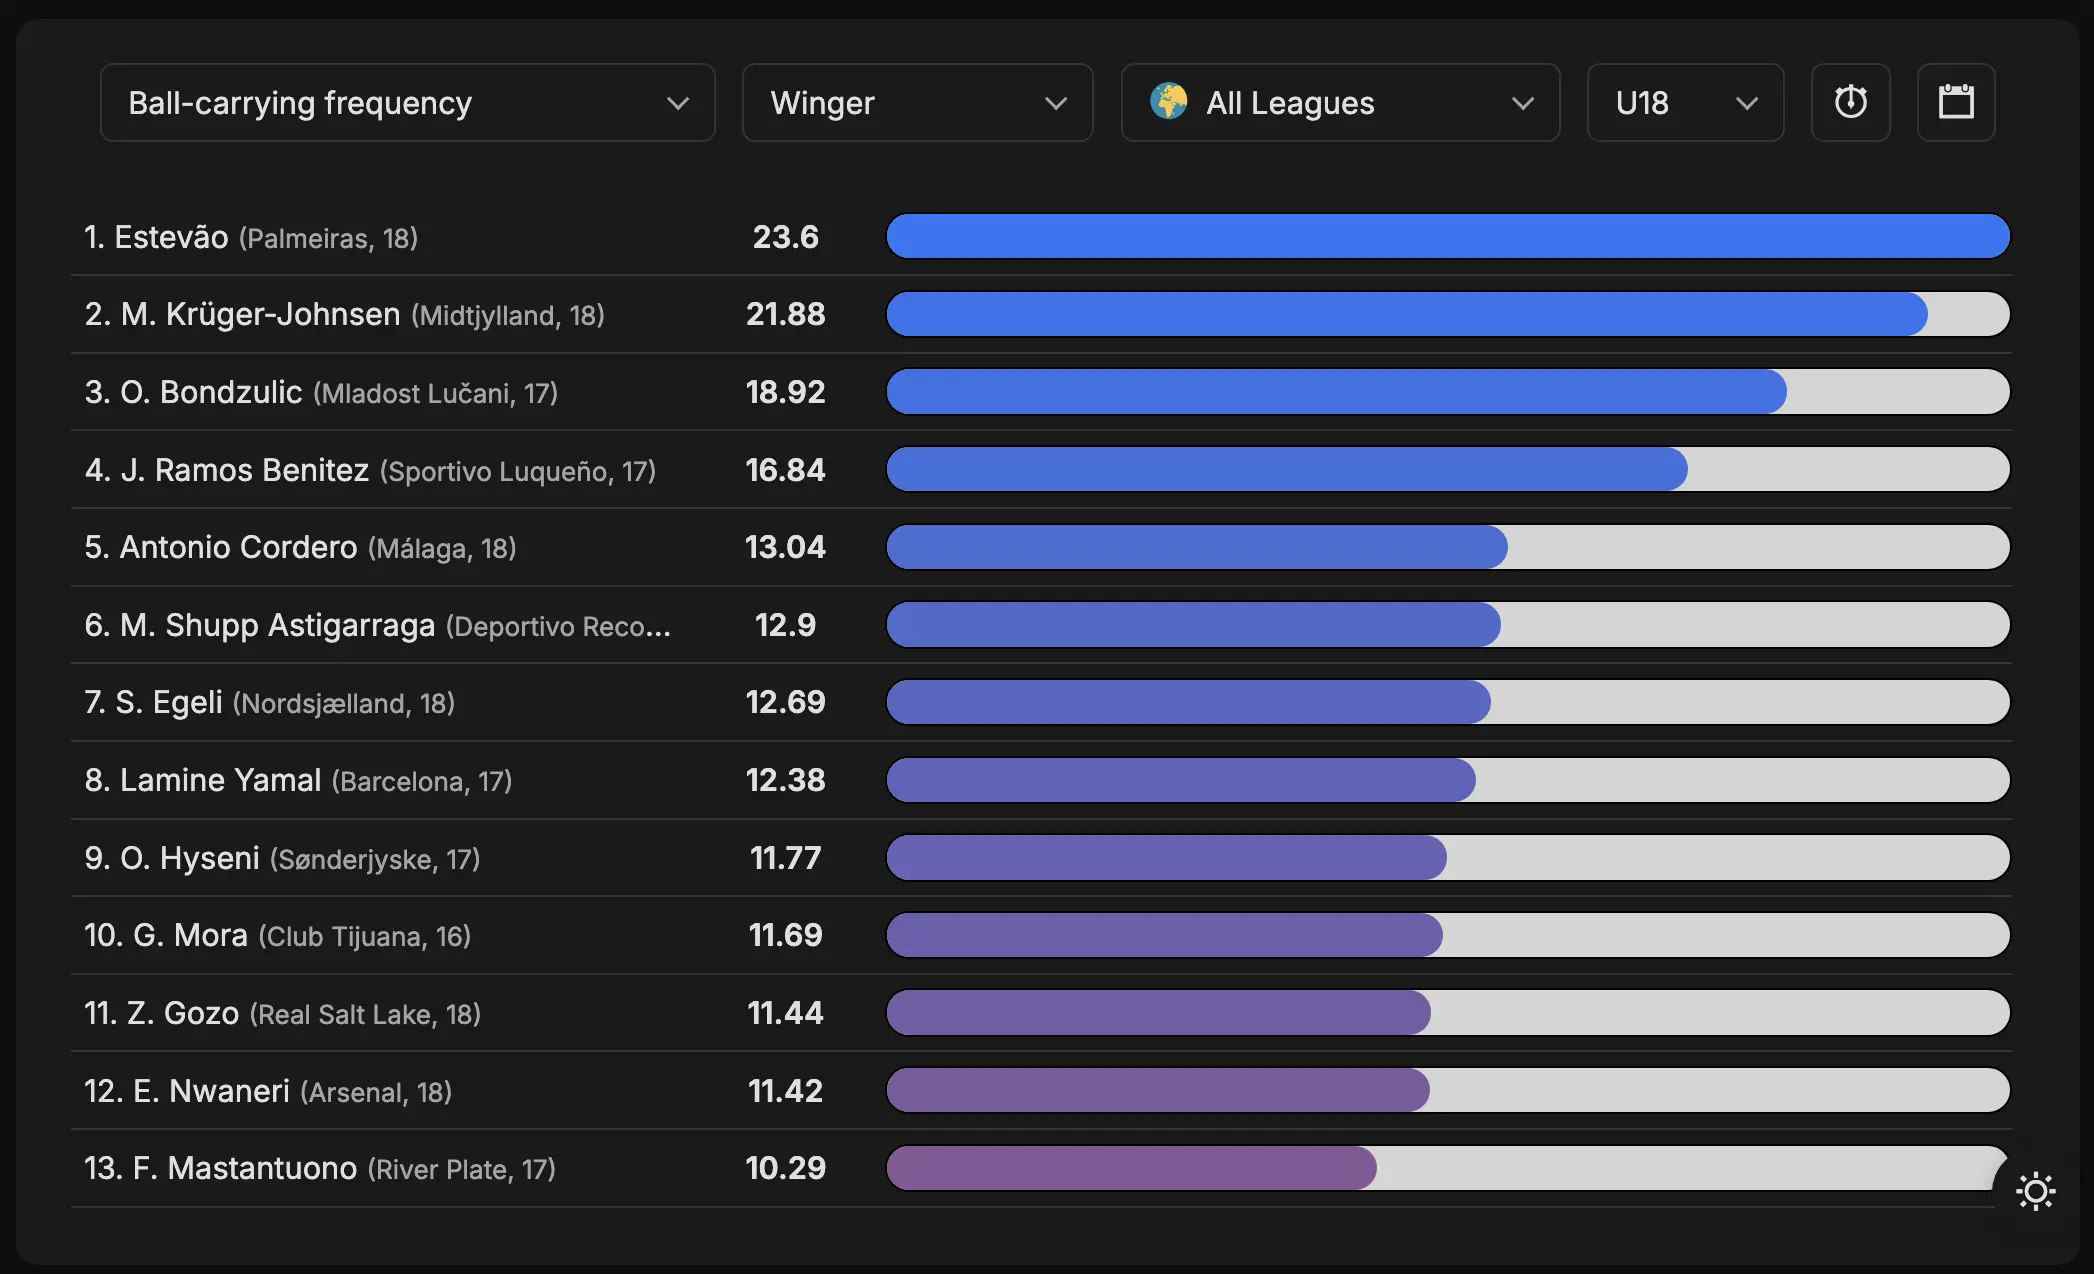
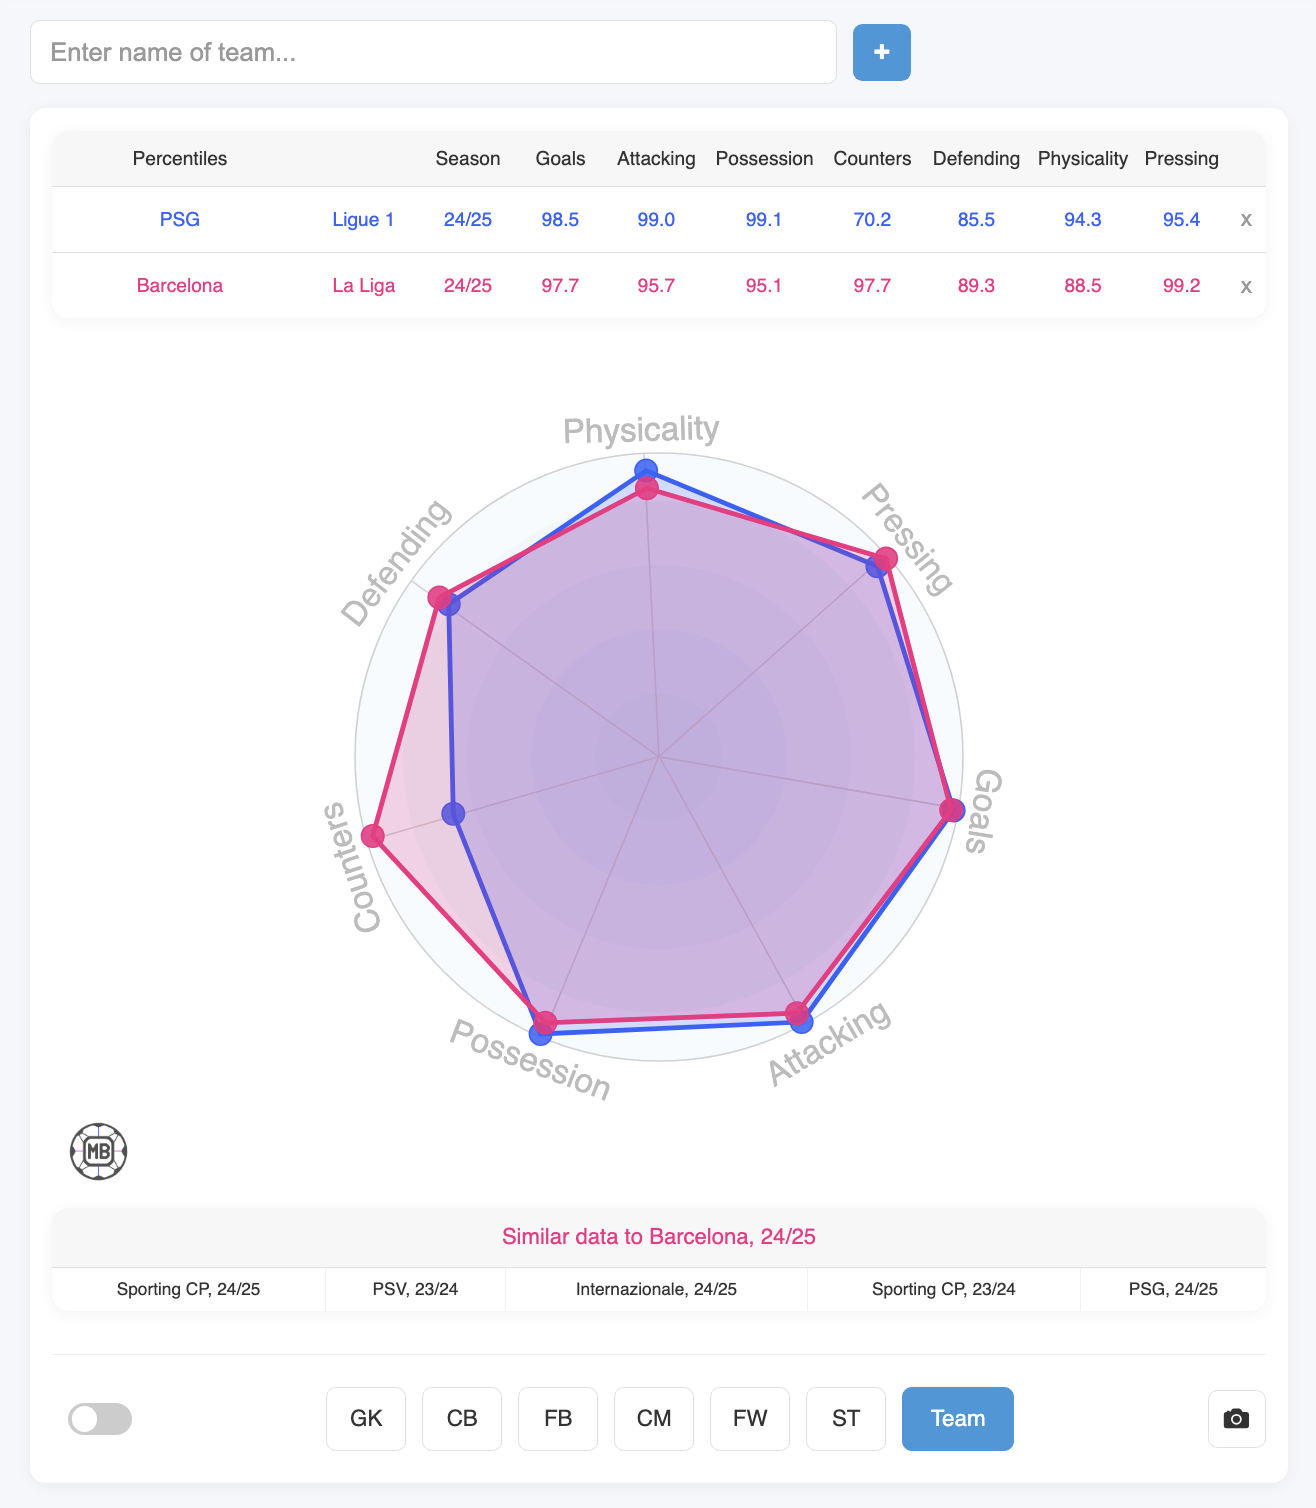
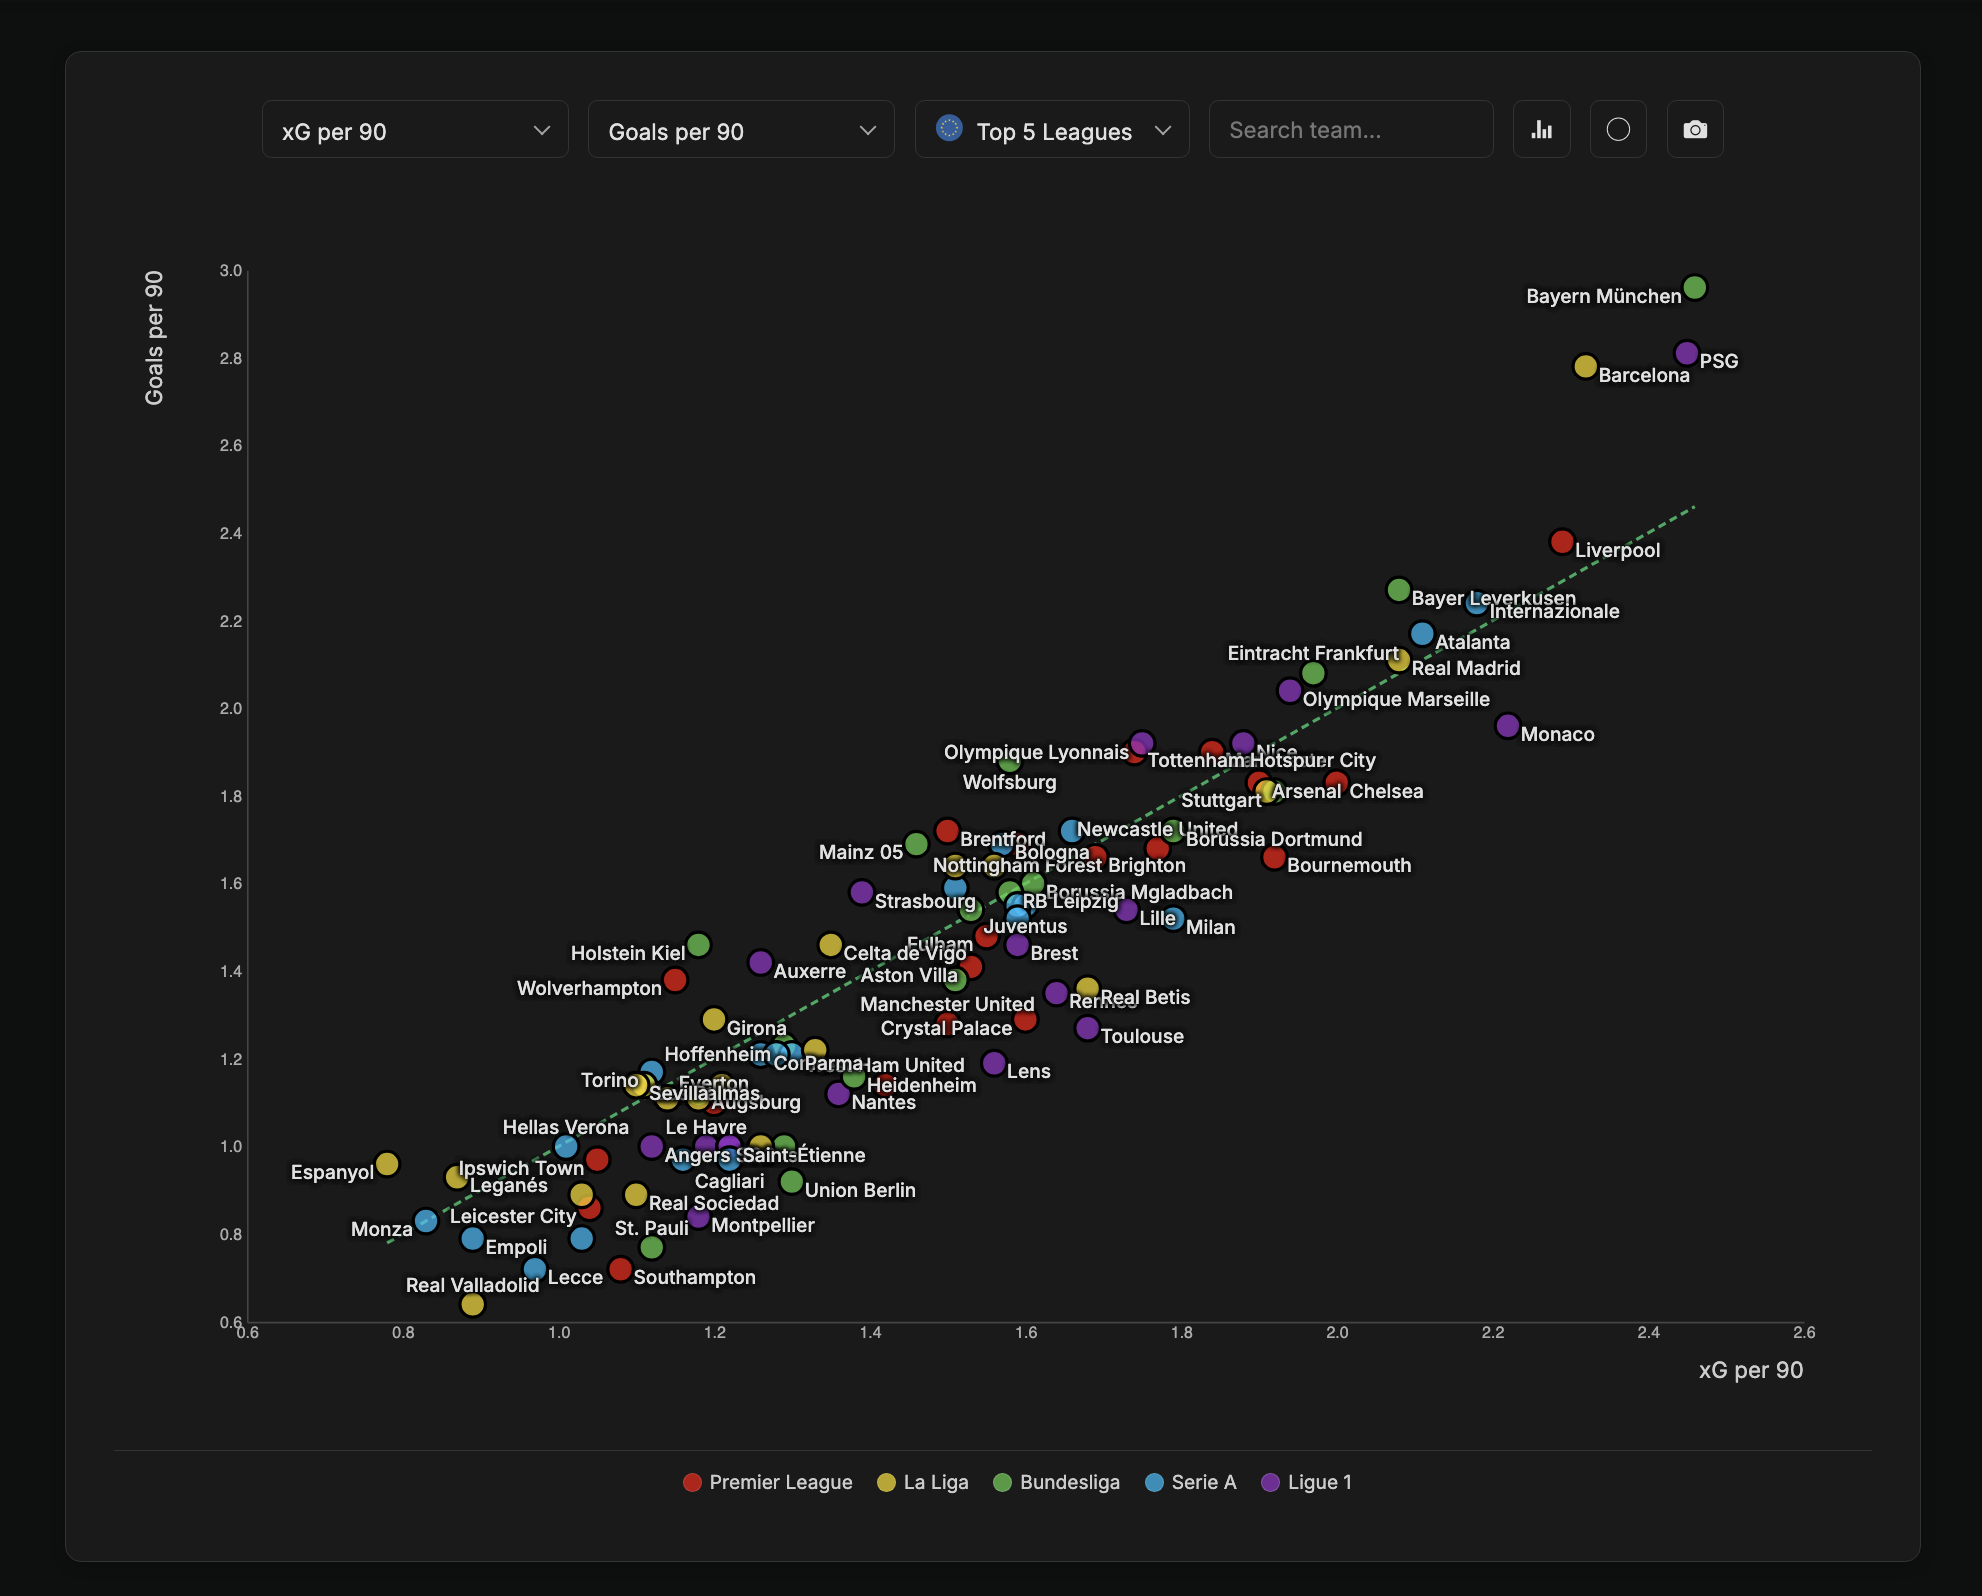
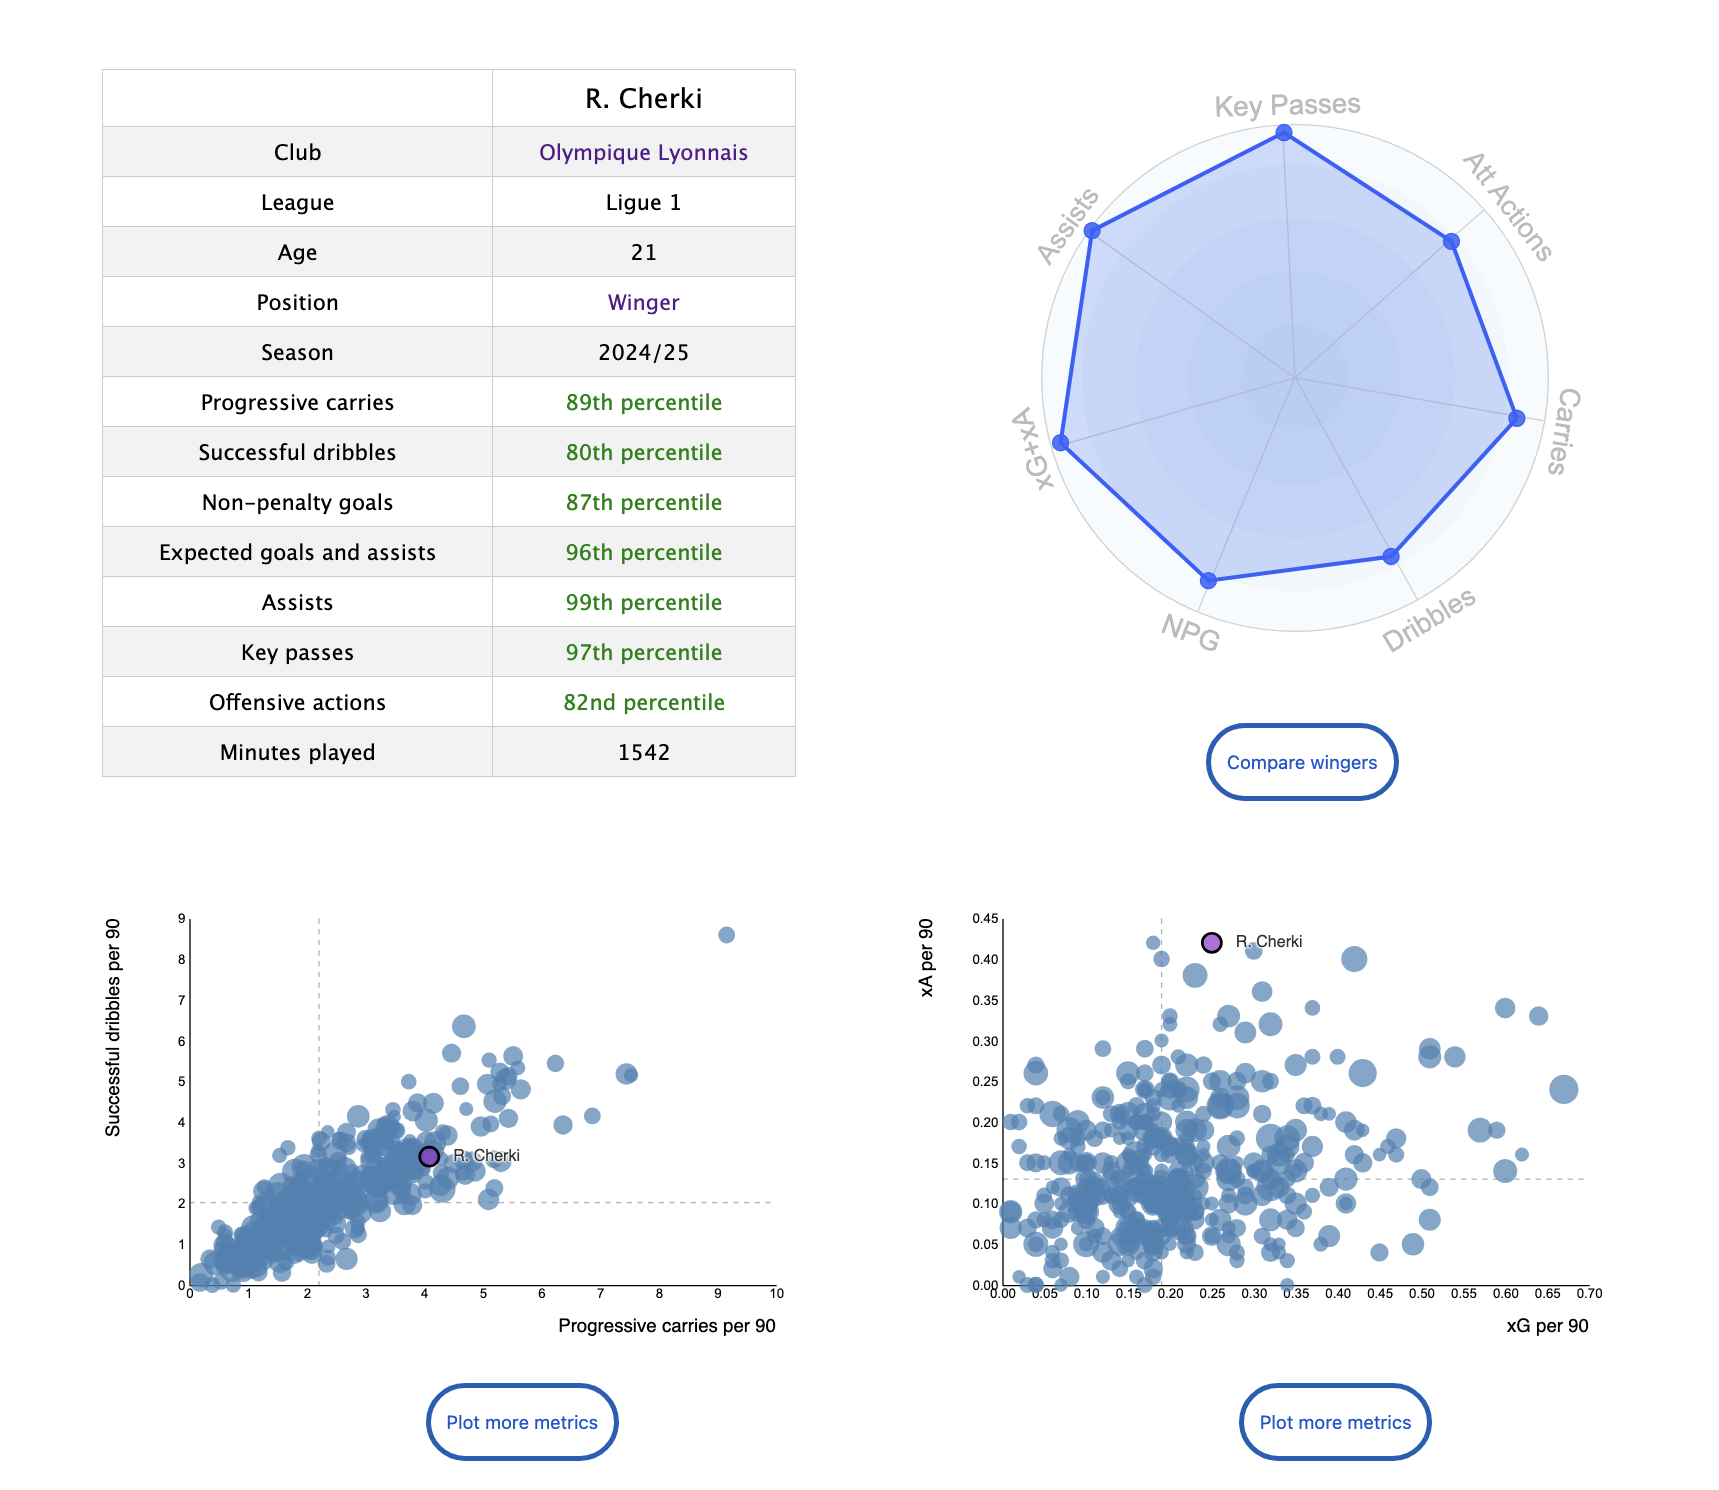
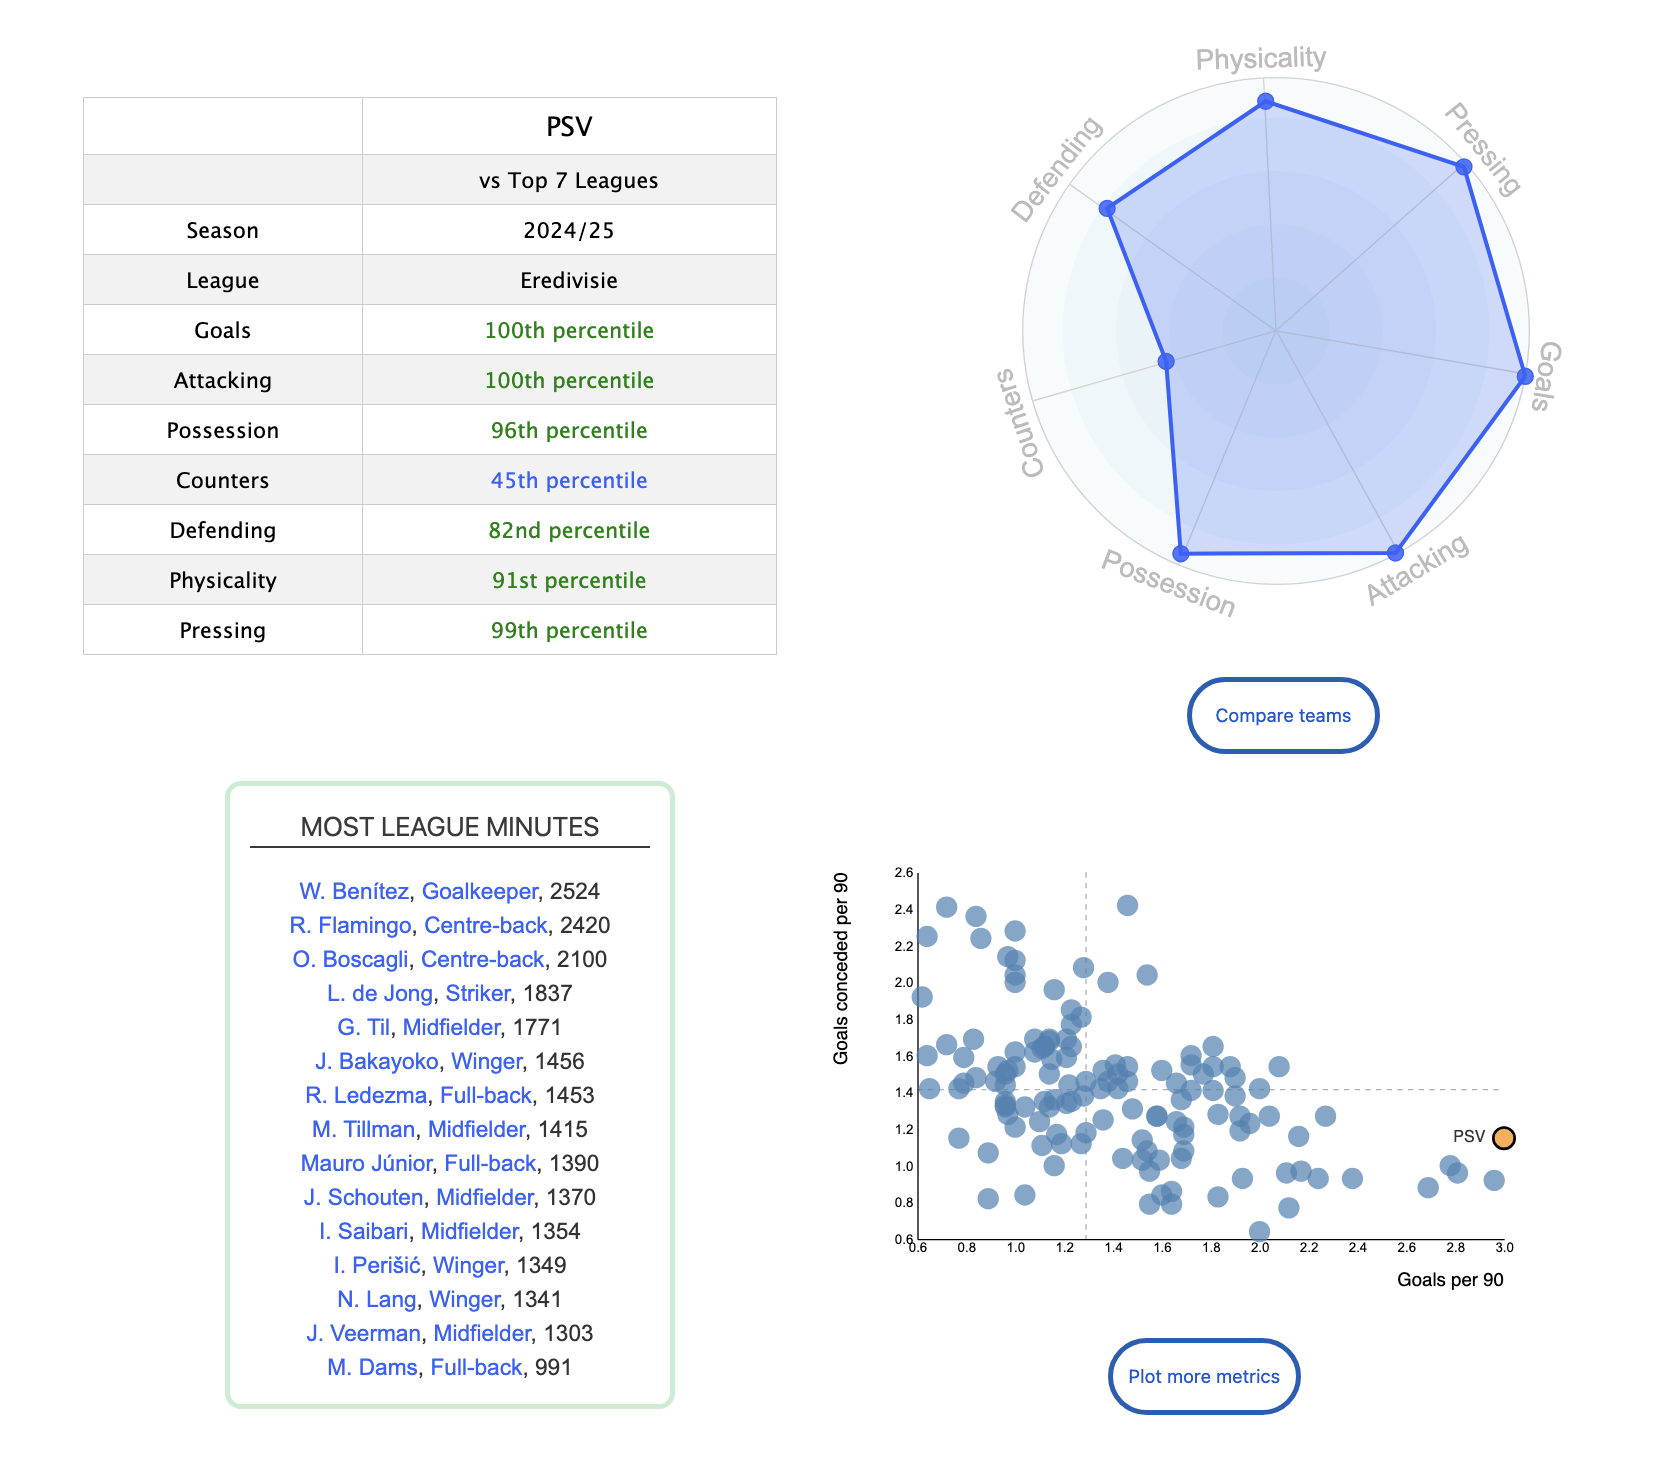
- A range of interactive tools to present data effectively in various formats. Look up data the way you want it, present the data the way you want it:
Our database and offerings are continually expanding with more leagues, metrics, and features to enhance analysis for all users.
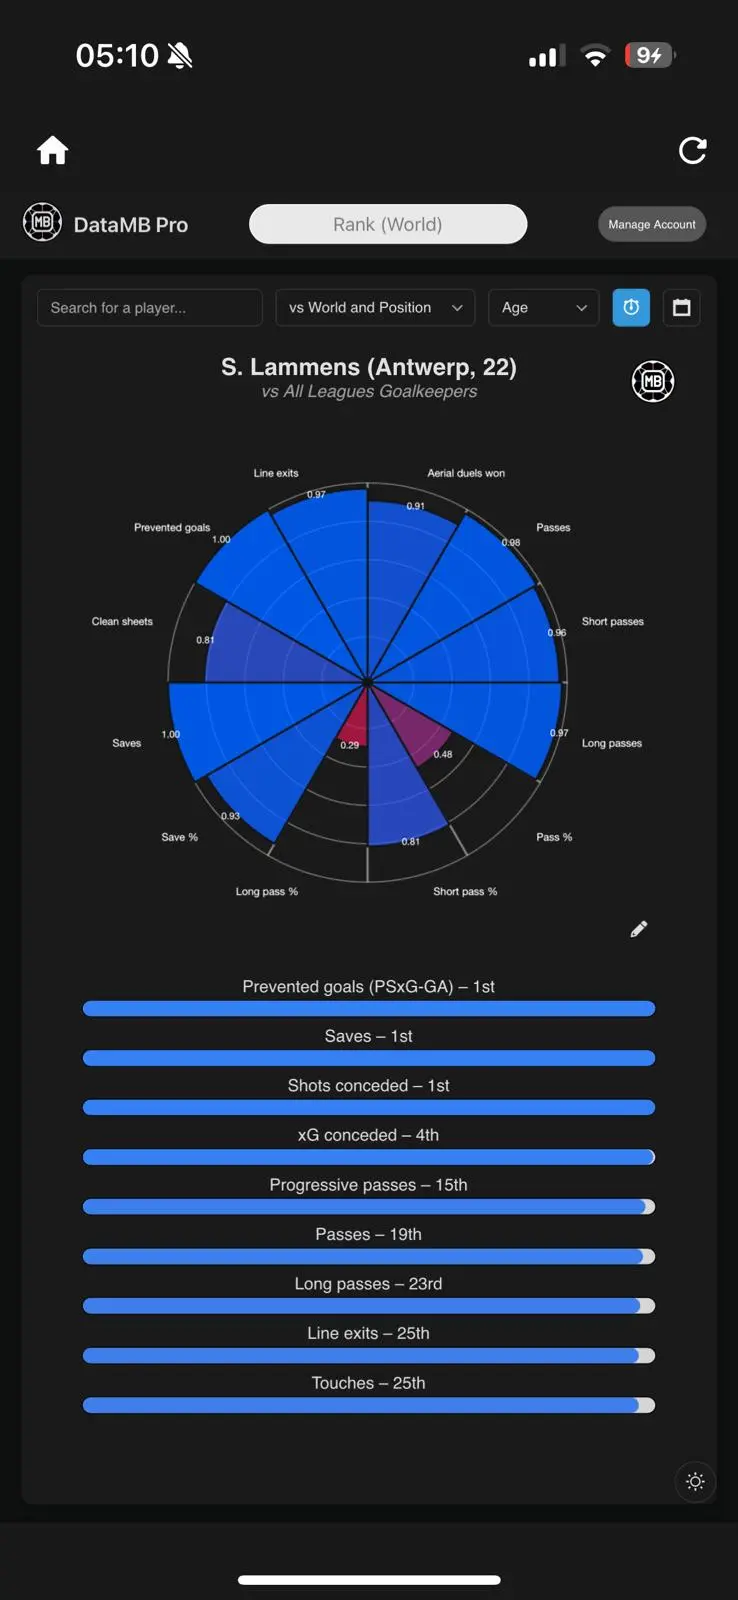
Beyond Raw Stats
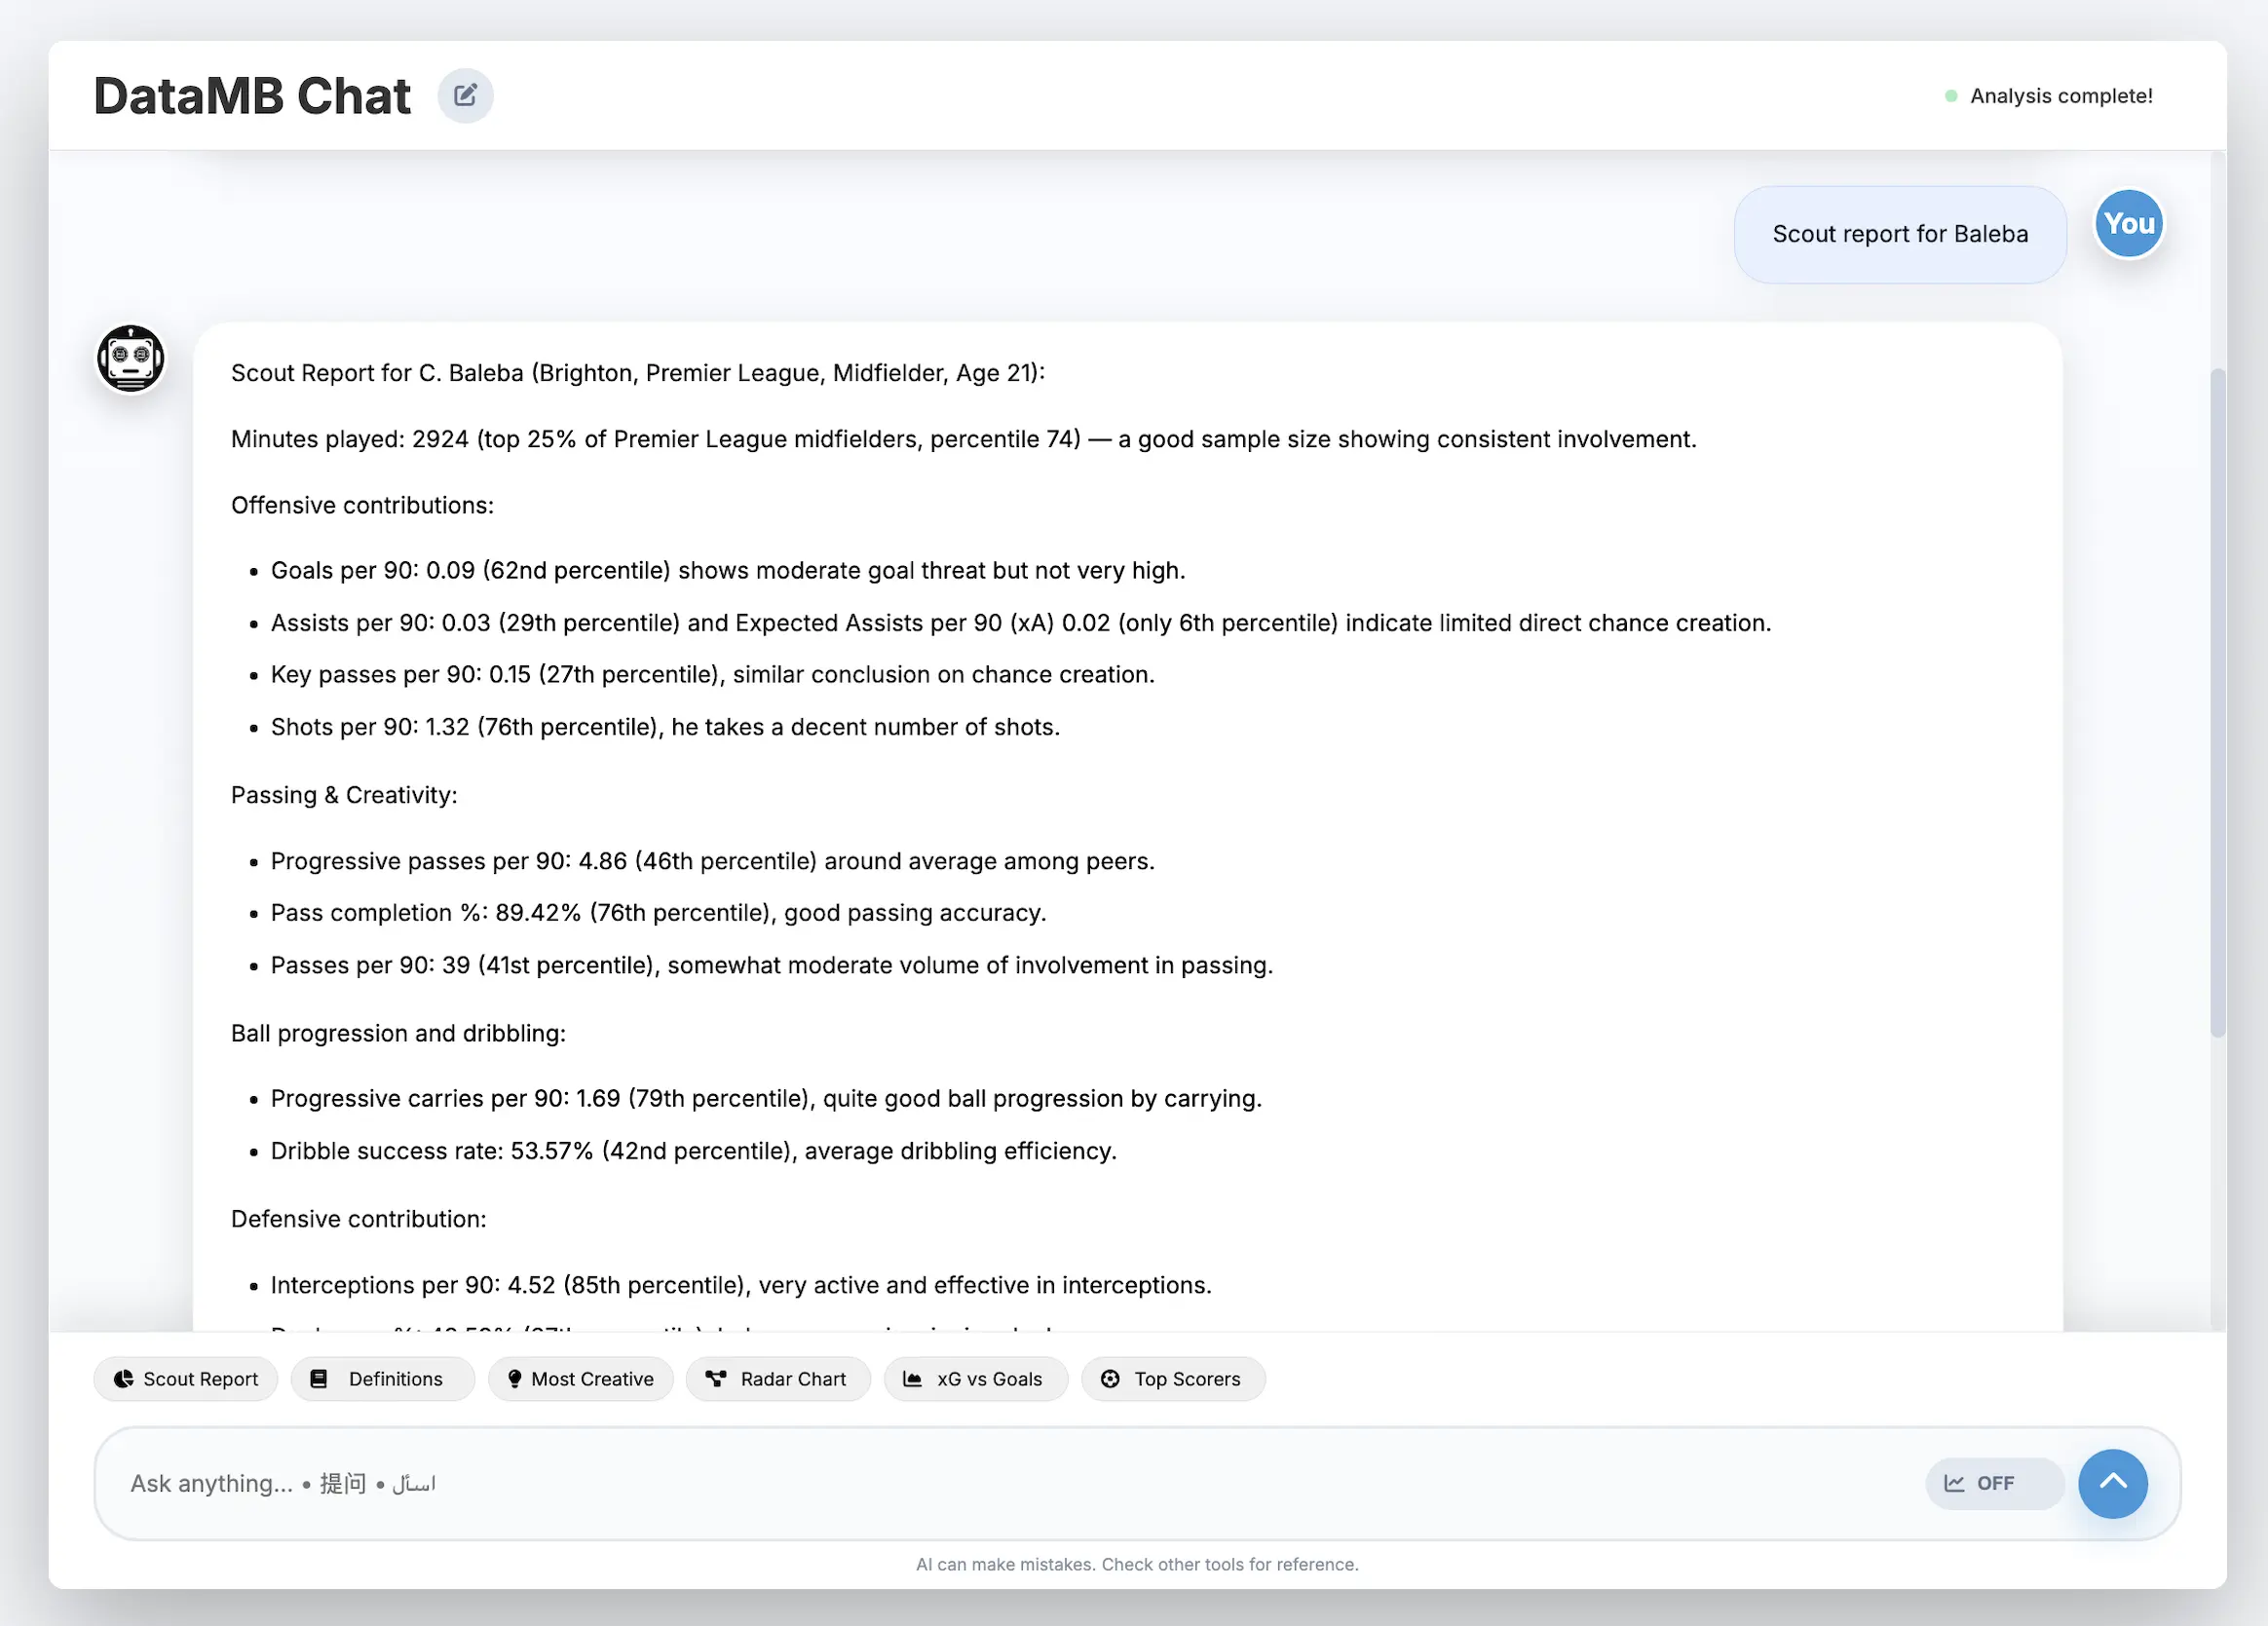
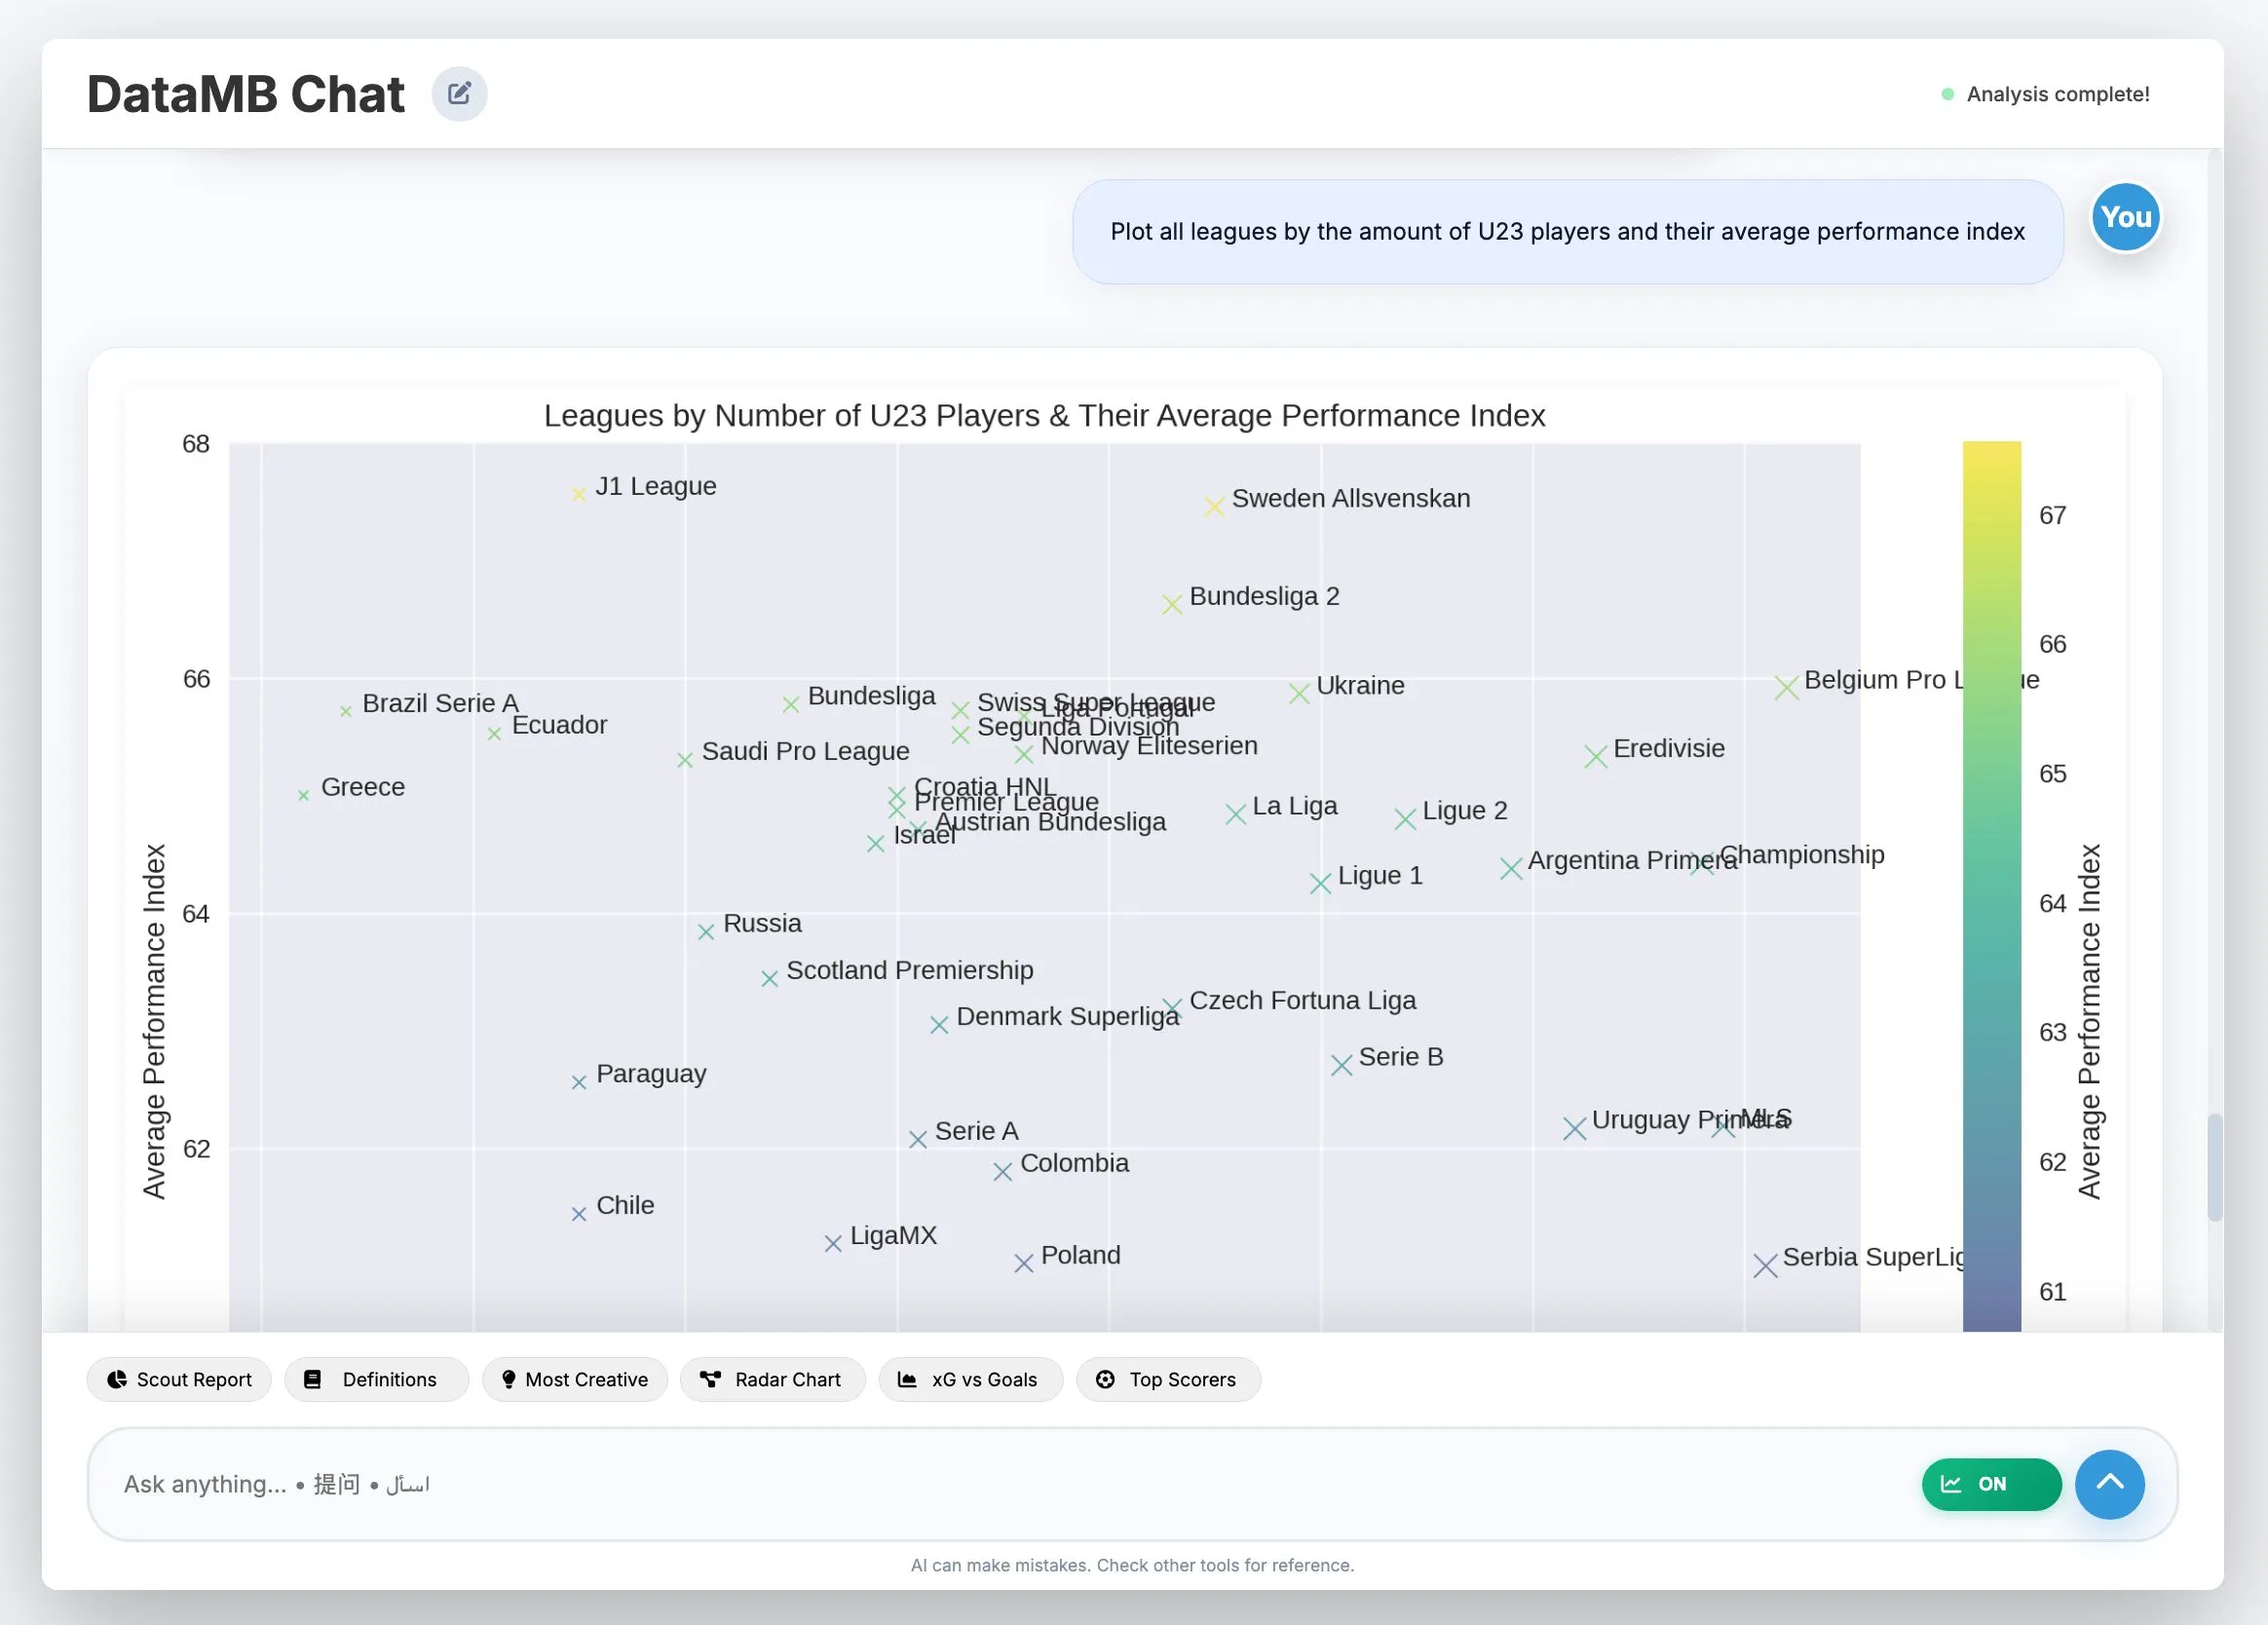
Football analysis isn't just about numbers—our tools provide deeper insights with accessible, contextualized visuals that you can personalize and tailor to your taste and needs.
We bridge the gap between traditional data visualization providers (which lack customization and interactivity) and the challenges of building your own visualizations from scratch.
Trusted by some of the biggest first division clubs and sports agencies, DataMB Pro's extensive database and interactive platform is the best value on the market for your data visualization needs.
Contact us for more information.